Tuesday, 23 December 2014

Nifty at 10000 in 12 months

Nifty at 10000 in 12 months?

 
Nifty at 10000 in a year? Before the next budget? Pretty sure most of you must have seen such headlines somewhere.  Here is a layman’s attempt at trying to figure out if these projections make any sense.

Nifty  vs. EPS YoY Growth Rate

First let us look at the way in which Nifty earnings per share (EPS) has grown year on year (YoY). To calculate this, first the EPS is computed (closing price divided by index PE) and then the growth rate is rolled over 1 year intervals.
Nifty-at-10000

Notice that the EPS growth rate (right axis) has been quite range bound in the last 5 years.   Looking at past growth rates during rallies, it seems to me that the rate at which Nifty has risen in the past 12 months is not as rapid as one would suggest. The rise is a sight for sore eyes, but one cannot trust sore eyes to make sound judgement.

Nifty EPS vs. Nifty PE

2-Nifty-at-10000

The nifty EPS (left axis) has pretty much increased at a steady pace of about 12% per year since Sep. 2002, barring the period during the 2008 crash and recovery.  More on this here: State of the Markets – April 2014
So I think one can safely project it for the next 12 months, assuming the same rate of growth (red line).
The EPS on Sep. 16th 2014 is ~ 376.
Projected EPS on Sep. 16th 2015 is ~ 397. Let us make it an even 400.
This corresponds to an EPS growth rate of about 6%.
This is perhaps a little too conservative estimate, but let us run with it.
Now if the Nifty touches 10000 on 16th Sep. 2015 for the first time,  the PE corresponding to an EPS of 400, will be 25.
Meaning: close to what experts would call, “extremely high valuations”.
Therefore, if the Nifty hits 10000 in the next 12 months with an annual EPS growth rate of less than 10%, the PE will become dangerously high. Meaning the so called ‘bull run’ will sooner or later come to crashing halt.
If the Nifty has to breach 10000, and  stay there for a decent amount of time,  the PE will have to be much lesser than 25.
If we assume the PE in a year to be about 22 with Nifty at 10000, the EPS has to be ~ 450.
This means that the EPS has to  grow by 20% from what it is today (16th Sep.).
Since the EPS has grown only by 8% in the last year, I am not too optimistic that there would be such a sudden surge in growth.
The current PE is ~ 21 (10Y average ~ 18.9). So even if the Nifty is at 10000, the PE is likely to be much higher than 22 as assumed above.
Let us hope/pray that I am proved wrong and that the Nifty comfortably breaches 10000 in a year and heads further northward :)

Update: Nifty Valuation analyzer – rolling standard deviation

Update: Nifty Valuation analyzer – rolling standard deviation

 
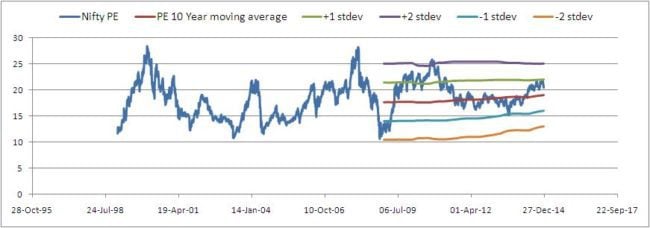
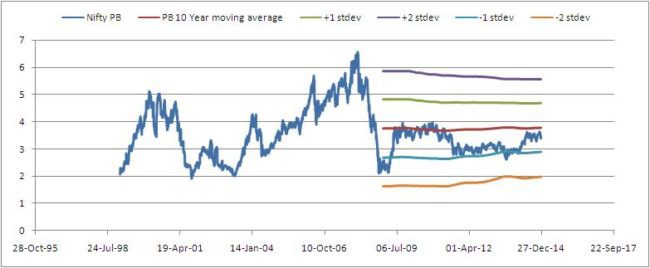
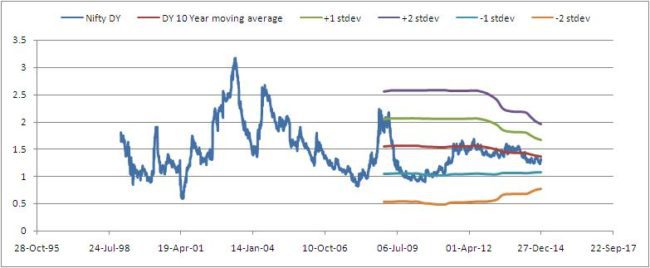
The Nifty valuation analyzer now has rolling standard deviation(stdev) curves plotted along with the rolling average PE, PB and Div yield curves.
As pointed out by Ravi Vooda, the
  • mean + stdev, and mean + 2*stdev,
  • mean – stdev, and mean – 2*stdev
curves might give a better picture of the market valuation.
Here are some results

Nifty PE

Nifty-analyzer-6

Nifty PB

Nifty-analyzer-7

Nifty Div. Yield

Nifty-analyzer-8

Notice that the standard deviation is more sensitive than the average to time. That is changes more rapidly as the days advance.  So while one can assume that the Nifty is dangerously overvalues when the PE and/or PB exceeds two standard deviations above the average, we must also recognise that the standard deviation and the average are changing with time.  So our assumption could be wrong.
I would like to make it clear that my interest in such analysis is only to find out dangerous valuations. There is no point in either not investing or pulliing out when the Nifty breaches, say  22.  As pointed out here

State of the Markets – April 2014

State of the Markets – April 2014

 
Are we at the start of a bull run?  Will the markets tank after elections? Should we book profits now, while the going is good? Should I invest now or wait after the election results are announced?
Such questions are on everyone’s mind. While dealing with volatile instruments like equity, some amount of tactical nous is necessary after a few years of investing to preserve the fruit of compounding. So while such questions are quite pertinent do not expect quant.-based answers to be far removed from commonsense and state what you would like to hear!
While someone who has just started mutual fund investing must continue their SIPs, someone with 5-6 years of experience will have to analyse the state of the markets every time there is a significant gain or loss in their equity or debt folio and respond appropriately. Including doing nothing!
This is an attempt by an non-expert to analyse the state of the markets with available information.
Nifty vs. Nifty Earnings Per Share
Using the definition of the price-to-earning ratio,
PE = Market Price per Share / Earnings per Share
We can calculate the Nifty Earnings per share from the Nifty closing value and Nifty PE. This is a crude estimate without considering the individual EPS values of the constituents.
State of the markets Nifty EPS
Notice the rather smooth increase in EPS when observed over a long period.
From about 2003 to the present, with the exception of the 2008 crisis, the EPS has increased approximately linearly. In the region covered by the blue line, the rate of growth has been 12%.
This can be thought of as the ‘historical’ long term returns from equity. Expecting more than this from your equity mutual funds is not a smart idea.
Of course the annual EPS growth (annual percentage change) fluctuates quite a bit.
State of the markets Nifty EPS growth
Clear from the table that in the recent past, EPS growth is a far cry from the bull run seen in the 2000s
Plotting the EPS using Nifty and Nifty PE tells us that the market is rewarding long term investor at a consistent rate regardless of short term instability and sideways movement. So whether you adopt tactical asset allocation or believe in averaging market movements with a SIP, you will be able to beat inflation.
Nifty vs. Nifty PE
With that piece of (obvious!) gyan behind us, let us look at the Nifty vs the Nifty PE.State of the markets Nifty PE
The long term Nifty PE movement is about 45-50% correlated with the Nifty. In the last year, this correlation is as high as 86%!
So looking at the Nifty PE alone can provide us decent insight into the state of the stock market.
Notice that the Nifty PE has remained relatively flat recently while the index has moved up. This means that the despite the recent rally the marker is neither undervalued or overvalued.
Nifty PE vs. Nifty EPS Growth (rolling annual % gain)
The EPS growth reflects the flat nifty suggesting that the present gains in the index is not part of a rally as historically, rallies have been accompanied with a sharp rise in EPS growth.
State of the markets EPS growth vs PE
So just because markets have improved for a month, removing capital now from your holdings in the name of booking profit is not a smart idea. If one must shift some gains that it has to be backed by solid logic.
Continuing SIPs is always a smart idea! (don’t need the graphs to establish that!)
If you have a lump sum to invest, should you do invest now or after the elections?
My view is, if there is not a single majority (a strong possibility because of the state politics), the markets would tank yes, but only temporarily. Even with a coalition govt, I expect the markets to rally in a few months time.
If there is a strong majority, the markets might soar but then in a few months time, normalcy would return.
Therefore, for lump sum investments, now or a couple of months later would not make a big difference over the long term.
If you have been investing for a while and if your portfolio has become lopsided by more than 5% because of the gains in equity, it would make sense to shift some of it to debt. Only some of it. Keeping in mind the tenure of the goal and its asset allocation.
This kind of profit booking is known by a more ‘decent’ name – rebalancing! If you wish to know more about this, suggest you start here.
At the end of the day, market movements are largely based on sentiments and hunches. When elections were announced, the markets reacted to the possibility of a strong govt but at the same time seems to be worried considering the different political equations at play.
The best quantitative indicator of ‘market sentiment’ is the Nifty Volatility index: India VIX
India VIX vs. Nifty PE
India VIX Nifty PE
Notice that India VIX has risen much more sharply than the Nifty PE in last month or so. That is the market is expected to be volatile in the next 30 days. So do not expect too much of a rally in this period.
Meanwhile, the 10-Year G-sec rates have increased! From 8.812% on Mar. 9th2014 to 9.104% on April 7th 2014.
Correspondingly the 1-year G-sec rates have decreased. From 8.913% on Mar. 9th 2014 to 8.654%  on April 7th 2014.
Thus the difference between 10-Y and 1-Y debt securities has widened.
The value of a bond has an inverse relationship with interest rate. If long term interest rates increase, the value of a bond has to fall  in order to match current yields. The NAV of a bond fund holding such long term bonds will decrease
Similarly if long term interest rates decrease, the value of a bond increases to match current yield levels and the NAV of the bond fund increases.
So when long term rates increase, debt funds with maturity duration much lower than 10 years is preferred and vice-versa.
Analogously, when 1Y rates decrease, debt funds with maturity duration higher than 1 year is preferred  
Well, all this means is that in the current interest rate scenario, for long term goals, one can invest in debt fund with maturity values higher than 1 year but much lower than 10 years.
Unfortunately, that is stating the obvious! This is an all weather recommendation for long term goals!
However, this does not mean equity is overvalued or unfavorable.
Tactical asset allocation: Yield-Gap vs PE
Tactical asset allocation refer to the method in which the asset allocation of a portfolio is changed rather dramatically in line with stock and debt market conditions.
This can be done in several ways.
Tactical asset allocation incorporates an element of market timing by determining which market is more favourable.
P/E model the value of stocks are evaluated with their price to earnings ratio. High PE(>22) exit equity in phases. Low PE (~ <15) buy equity in phases
As mentioned above, according to the ‘PE model’, the market is neither overvalued or undervalued. So the ‘signal’ is stay put.
Yield Gap Model Instead of looking at only the stock market,  the price of the equity index is evaluated with respect to the debt index.
Defining Yield Gap like the DSP BR Asset allocation fund,
Yield gap = (10 year Govt. Securities yield) X (P/E Nifty index ratio)
The Yield Gap was 1.62 on 9th March 2014 and has increased to 1.72 on 7th April,
The 10 year G-sec rates are primarily responsible for this increase since the Nifty PE has more or less remained constant in this period.
Nifty PE vs Yield Gap
So if you take this increase in yield gap ratio seriously, you ought to decrease equity holding by a good 10-20% and shift to debt (see asset allocation strategy of the DSP BR fund)
Not sure if this is a smart thing to do when the Nifty PE has remained flat in that period and close to its long-term average.
Nifty long term average
If you see the 10 year moving average of the Nifty PE, you will see that we are still quite close to the average. This is true for also the 15 year average ~ 18.3.
So there is no need to tinker with the equity folio, unless it has shifted by more than 5% of the intended asset allocation.
The yield gap model is too conservative compared to the PE model and I think is unsuitable for young investors who ought to be aggressive. I think it should be used only in conjunction with the PE model.
Perhaps what one can do is to increase investments in debt funds  mentioned above, without tinkering with existing equity holdings.
So let us summarize:
New to mf investing: stay invested.
Goal less than 5 years away: Book some profit and prepare an exit strategy.
Goal more than 5 years away: Rebalance if equity portfolio has increased by 5% or so, or if your folio is not balanced in the first place!
Not investing with a goal in mind: find one first! The state of the markets can wait!
Feel free to leave a comment if you need the Excel data files for any of the plots in this post/blog.
Postscript In response to Deepak’s comment below, here is the  CNX 500 PE vs 10 PE moving average. Although the CNX 500 appears to be a bit more overvalued than the Nifty, I don’t think it is high enough to exit equities. It does require a close watch though.
CNX 500 PE moving average

India VIX: The Stock Market Volatility Index

India VIX: The Stock Market Volatility Index

 
As a student of market volatility, my eyes popped out in interest to learn that we have index that gives an idea about market volatility – the India Vix. India VIX is a measure of how volatile the market is expected to be over the next 30 days. Its calculation isdescribed here in extraordinary detail.  It is measured using Nifty Option prices  (why do I keep reading this as Nifty onion prices?!). Here is a good non-mathematical read:How is India VIX calculated?   
  • It is reported as a percentage.
  • A high value corresponds to high volatility in the next month and a low value corresponds to low volatility over the same period.
  • It is not a buy or sell indicator.
  • It is a short-term indicator of investor ‘fear’ and confidence
  • As a projection, it is subject to assumptions and approximations and must be used with caution.
  • India VIX is calculated based on the methodology outlined by the Chicago Board Options Exchange with some modifications made for use with the Nifty order book. They track US market volatility with VIX.
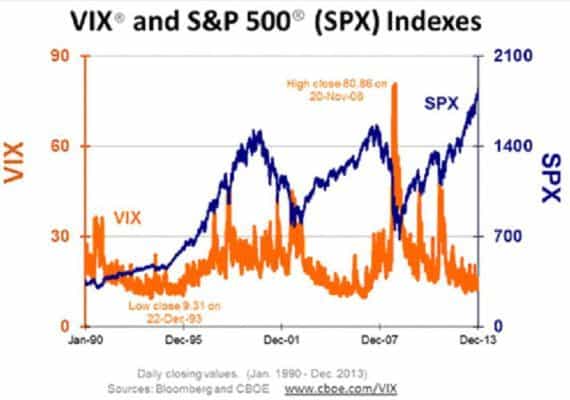
  • Here is how the VIX (US) correlates with its underlying index the S&P 500.
VIX
Picture courtesy: Chicago Board Options Exchange
  • Notice that when VIX is low and does not fluctuate too much, investor confidence is high and the Index rises.
  • Sharp drops in the index increase the fluctuations in VIX.
  • Historical data for India VIX is available only from 2nd March 2009.
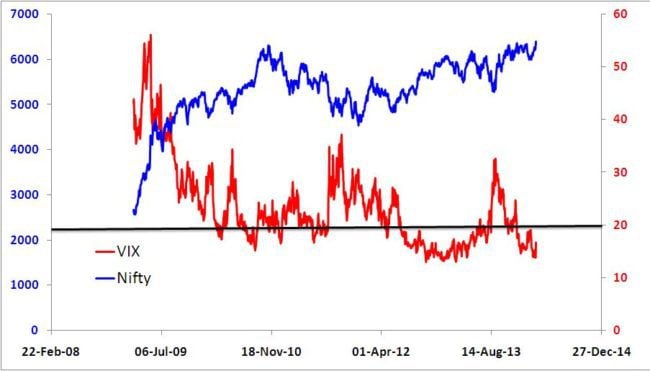
  • Here is how India VIX looks like when plotted alongside the Nifty.
India VIX vs. Nifty
  • There is a good 81% negative correlation between the movement of the Nifty and India VIX. That is, Nifty highs corresponds to VIX lows and vice-versa.
  • Again a decreasing VIX with low fluctuations can be taken as a sign of positive outlook and a market rally at least in the short term due to increase in investor confidence and decreasing fear.
  • The high volatility in 2011 is a result of global economic fears and high interest rates.
  • The sharp VIX peak in Aug. 2013 corresponds to the sharp drop in the value of the Rupee.
  • The volatility has been steadily decreasing for close to two years now.
  • Does it mean this is a good time to invest? The VIX does not exactly tell you that. However, it does tell you that the nerves are calming down, and the confidence in the India-Growth dream is growing.  Therefore, from that point of view, yes it is a good time to be in the market!

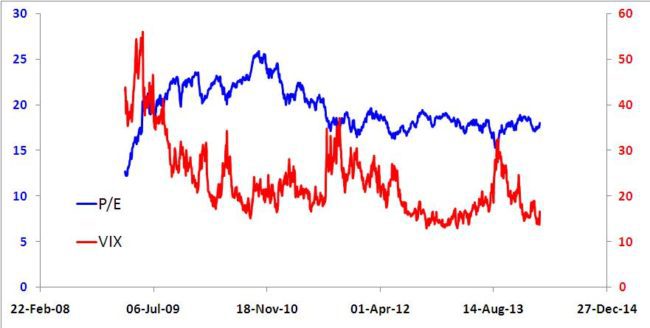
  •  Here is how the India VIX and Nifty P/E have evolved
India VIX vs. Nifty P/E
  • An upward spike in India VIX seems to correlate with a dip in NIFTY P/E. However, the correlation between the two is quite poor (-12%). This is to be expected as P/E considers earnings over the last 12 months.
  • Curiously in late 2010, when P/E was close to 25 a clear ‘sell’ indicator, the value of India VIX was ~ 20% a reasonably ‘low’ volatility.
  • However, India VIX fluctuated rapidly in this period.
  • This suggests that, for the long term investor, fluctuations in India VIX over a period, rather than the daily VIX value is a more useful indicator of market volatility.
  • Long term trends help assure ourselves of the benefits of staying invested.
  • In hindsight, past data of a future predictor reveals more that its daily value!
  • Investors can now diversify their portfolio or hedge portfolio risk with market volatility!India Vix Futures
  •  It is good to know that confidence in the market is growing.  Let us hope it lasts … and spills over to the retail investor.

Anatomy of a Bull Market

Anatomy of a Bull Market

 
The markets are on fire this year. For many, including me, this is the first bull market.  We have all made phenomenal gains and hope the run will continue. However, between early Jun to early Aug 2014, the market went nowhere. All though relative to the long history of the market and relative to any long-term goal like retirement, this period is like a blink of the eye many were concerned!
When the markets moved northward after that they were worried about the ‘new highs’. Soon followed questions like, ‘should I continue investing?’, ‘can I start a SIP now?’, ‘should I book some profit?’, ‘should I rebalance now?’ etc.
If this is a bull market, we have been in one since the middle of 2012. If this is a bull market, I think it would serve us all well if we examined the previous bull run. Hopefully, this will prepare us better.
First let us start at a plot of the Nifty and it PE between 25th April 2003 to 14th Dec. 2007.
Bull-Market-1

Notice the prominent dips as the market moved up. They were mini crashes as they occurred with a month.  Investors who got scared and pulled out during these dips would not have benefited from the rest of the run.
Who could blame them? Have a look at the monthly gain or loss chart
Bull-Market-2

During the bull run, the market moved up by about 10% each month on an average, but there were prominent losses. Over some months, the Nifty lost close to 10% (4 time), 20% (once) and 30%(once).
Now let us look at how the CAGR of a lump sum investment made at the start of the ‘bull run’ would have evolved.
Bull-Market-3

From euphoric triple digit highs the CAGR sharply dropped to settle down around 50-60% range! With each prominent monthly loss, the CAGR dropped down noticeably.
The final CAGR at the end of the period was 56%.
This is how a SIP made during this period would have evolved.
Bull-Market-4

Total investment: 1000 x 55 (months) = 55000
Total Value: 1,53,511
CAGR (final): 46%
This is how the CAGR evolved after each installment of the SIP
Bull-Market-5

The initial high values observed are normal.  CAGR becomes reliable only after 1 year.
Notice that at one point the CAGR dropped to 11%.  Again with each prominent monthly loss, the CAGR dropped down noticeably.
Conclusions:
A bull market is no joyride.
The market is likely to correct itself from time to time, consolidate and only then move up.
The corrections would be violent, leading to significant losses. Whether these losses or notional or real depends on the grit of the investor.
I will conclude with two relevant quotes:
“I’m not telling you it’s going to be easy – I’m telling you it’s going to be worth it.” ― Art Williams
“Fasten your seatbelts, it’s going to be a bumpy night” ― From the movie “All about Eve”

You might also like:

Misconceptions about the Nifty PE

Misconceptions about the Nifty PE

 
Are the markets overvalued? Is the Nifty PE too high? Should I exit and re-enter later? Aided by  ‘experts’ who advice ‘caution’, such questions are doing the rounds again.  Here are some misconceptions and myths about the Nifty PE.
In a previous post on the relevance of the Nifty PE for the long-term investor, I had shown that whether one exits at high PE and/or re-enters or high PE, there is no guarantee or loss-prevention or  large gains and that there is a huge spread in returns.
I wrote,  the case for not investing at high PE (~ 25) remains strong enough, whereas the case for investing only at low PE (< 15) has weakened, thanks to the wide range of returns possible.
Dumb me,  I missed the obvious corollary:
If I exit at PE = 25, when do I enter? The answer is whenever!
So one could, and must argue, why exit in the first place if your goal is several years away?
Unfortunately, neither can we rely on past data (our market history is too short), nor can we invest without emotion. So  for someone with considerable net worth, it is not a terrible idea to reduce equity exposure at 25 PE.
There is the danger that after exit the markets may create history and keep moving up  but I think it is not such a terrible issue for a mature person.
With that out of the way, let us consider what Prof. Sanjay Bakshi writes in an article titled,“Keeping you out of trouble: your resolutions for 2009 and beyond”, he says
Resolution 1: You will avoid equities when they become historically expensive
Recent research done by my firm shows just how dangerous it is to remain invested in an
expensive market. Since NSE started, every time when Nifty’s Price/Earnings ratio exceeded 22, the
average return from Indian equities over the subsequent three years became negative — see
accompanying table.
Nifty’s PE        Three year returns%
Less than 14    152.10%
14 -16                112.36.%
16 – 18               79.14%
18 – 20              51.18%
20 – 22              21.18%
22 – 24            -14.98%
24 – 26            -32.92%
26 – 28            -36.60%
28 – 30            -40.17%
I am afraid averages without considering standard deviation or the spread is of little use. To imply and to assume that the return was negative when PE exceeded 22, based on this result is baseless, at least for Nifty stocks.
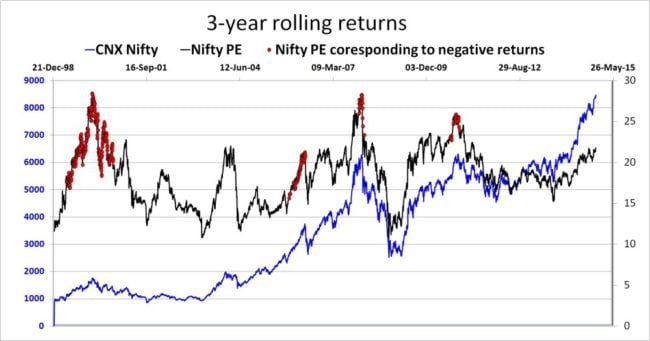
Rolling returns offer better insight.
nifty-pe-myth-1
The red dots refer to the PE when 3 year returns were negative if invested on that date.
Notice most of the data is centered around the dot-com crash. PE values from about 16 to 20 led to negative returns and not just 22.
Notice the small bunch of red points right in the middle of the so-called ‘bull run’. Related reading: Anatomy of a bull market
Then  we have some points just before the 2008 crash and some points in 2010 when PE was close to 25.
A negative 3 year return and a PE of 22 or above occurred only 42.7 times out of 100! The rest of the times, the negative returns came when PE was between 15 and 22! Please don’t bet that a high PE implies a low return …. at least over 3Y!
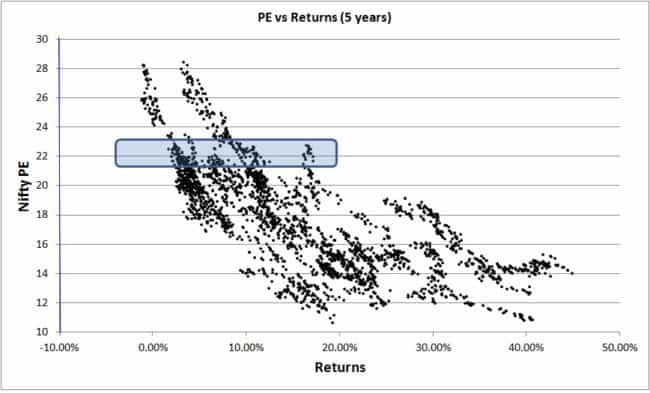
Notice the spread in returns possible corresponding to the PE on the date of investment. Current PE is close to 22. So the blue box tells you what to expect or rather what not to expect.
nifty-pe-myth-2
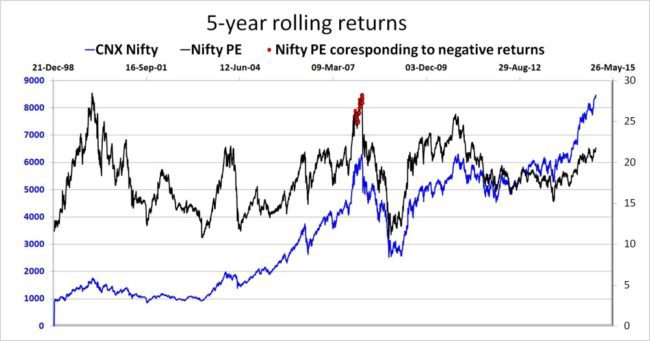
Now to 5 year returns. There is not enough negative returns data available. All points in that bunch correspond to a PE greater than or equal to 24.5.
Meaning, if you stay invested for 5 years, current PE most likely does not matter!
nifty-pe-myth-3
Notice that the bunch (below) has not shifted to the right. Again the spread is too large.
nifty-pe-myth-4
You can see similar graphs for longer durations here: relevance of the Nifty PE for the long-term investor
Here is the Excel sheet used
Moral of the story: If you want to exit because the PE is ‘high’, please do not point to market history. Point to yourself.

nifty si pe

Relevance of the Nifty PE for the long-term investor

 
Ever since I introduced the concept of SI-PE (PE based SIP investing) in the post, Are Mutual Fund SIPs Suitable for Disciplined Long-Term Investors?‘, I have been worried because it instantly struck a chord with many readers.
SI-PE refers to manual investment based on the PE value of an established index. If the PE is greater than 20 (value chosen arbitrarily! ), monthly investments are put on hold. All the uninvested amount is invested in one go when PE drops below 20.
In  the same post, it was shown that a SIP (blind monthly investing regardless of the state of the market) works perfectly for the long term investor. SI-PE scores over the SIP but only by a little.
Since then I have received many questions on the SI-PE, leaving me worried.
Is the Nifty PE really relevant for the long-term investor? Of course, if I invest when the PE is 28 and look at my holding a year later, I am almost certain to have lost money. What if I chose not to touch my holding? What if I held on to it for say, 10 years?
Would it still make a difference?
In this post, let us try and answer this question. I present below a series of plots of the Return obtained versus Nifty PE corresponding to the investment date for durations ranging from 1Y to 13y. The data was obtained with the rolling returns calculator. Nifty closing values and PE from 1st Jan 1999 to 30th June 2014 were used for the analysis
If you need the Excel sheet, leave a comment.
These plots are wonderful examples of market volatility. So I suggest you stare at them for long periods of time!

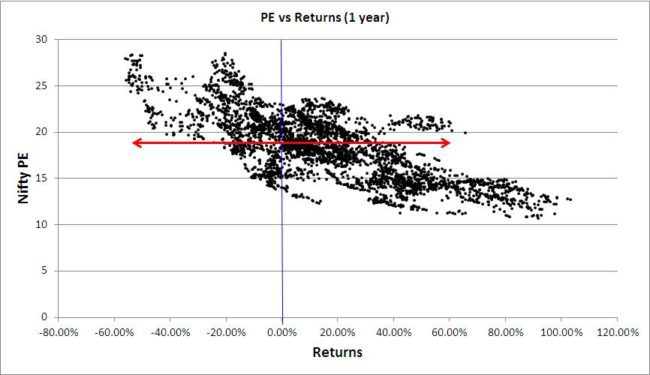
1-year

Nifty PE vs return 1 year
The vertical blue line represents 0% returns! The horizontal red line represents the range of returns possible for a give PE value.  For example, the current Nifty PE is a little less than 21. So if you invest a sum now, the return after a year could range from -50% to +60%. Just about anything.
However, if the PE was 25 or more, The return is likely to be negative (-50% to -10%).
Interestingly if the PE was close to 10, the return can still vary by a huge margin (+30% to +90%)
Notice that the bunch of points slope  down from the top left to the bottom right of the graph. This is referred to as a negative correlation: Higher the PE, lower the return. The width of the bunch represents the extent of correlation. That is, if the range of returns possible at a given PE is narrow, the (negative)correlation is strong.

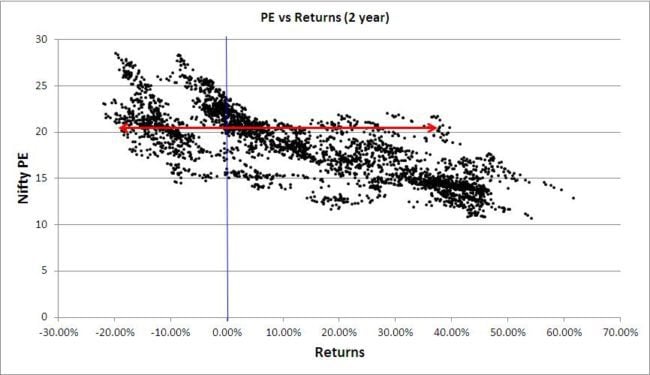
2-year

Nifty PE vs return 2 year
Notice the range or returns possible for current PE levels (red line). Again just about anything.  Higher the PE, lower the return, but the range of returns has increased.

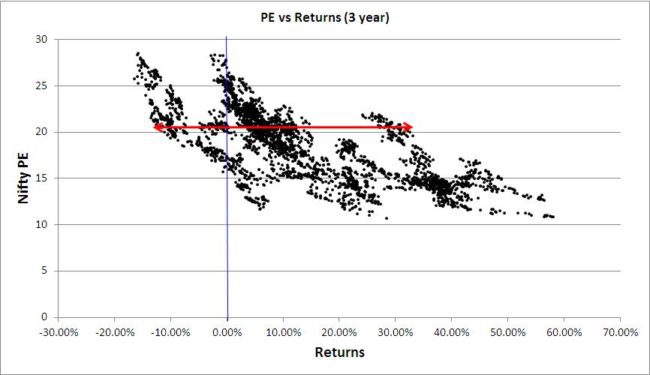
3-year

Nifty PE vs return 3 year

Notice that the bunching has disintegrated. The points have spread out and the negative correlation has reduced.  Returns for a sum invested 3 years ago at a PE ~ 11 can just about be anything, 5% to 60%! Investing at high PE levels still implies a negative return.

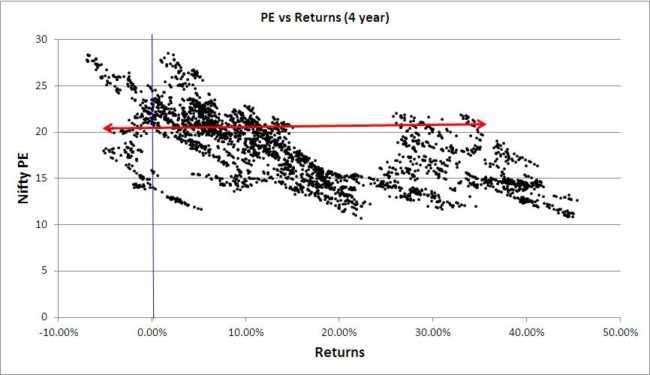
  4-year

nifty-pe-analysis-4

The negative correlation has lowered further. The range of returns possible for investing at low PE has increased :(
Notice that the bunch of points is moving toward the right – more positive returns.

  5-year

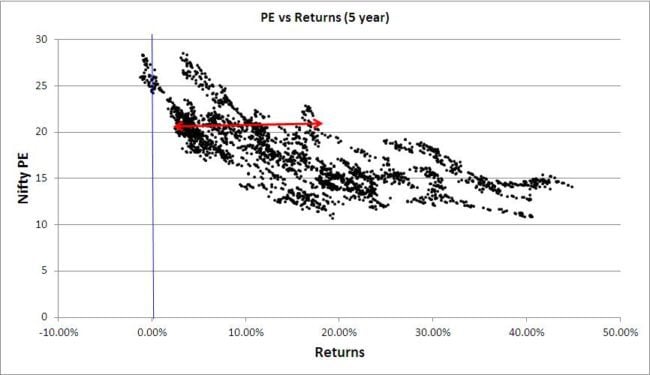
Nifty PE return 5 year

The bunch has now moved almost entirely in the positive region. Surprisingly the negative correlation has strengthened now. That is the bunching is tighter now. If one invests at a PE level of 25 and above, it would take about 5 years to get a small but positive return!
So the case for not investing at high PE levels is very much alive!
Surprisingly the case for investing at low PE levels  comes tagged with a huge spread in the  possible ‘high’ returns.

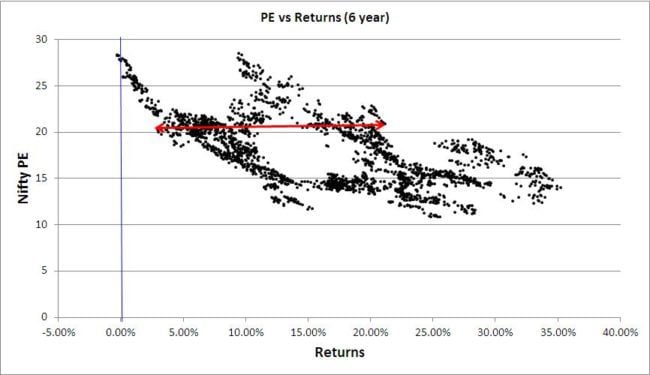
6-year

Nifty PE vs return 6 years

The plot looks like a swordfish! Again the bunching has reduced for low and medium PE values.  The bunching is tight at high PE levels (the sword!)

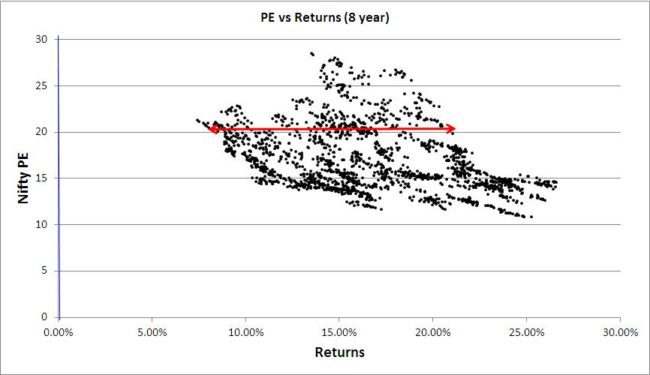
8-year

nifty-pe-analysis-8

The bunching has reduced again! Investing at PE levels of 15 and lower has very high chance of getting a double-digit return. Not enough high PE level data points. Whatever exists completely contradicts the high-PE equals low-return theory!!

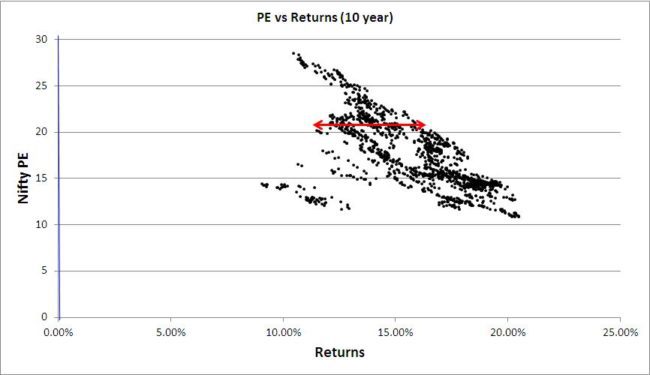
10-year

nifty PE 10 year returnsThe bunching and negative correlation returns!

12-year

Nitfy PE 12 year return


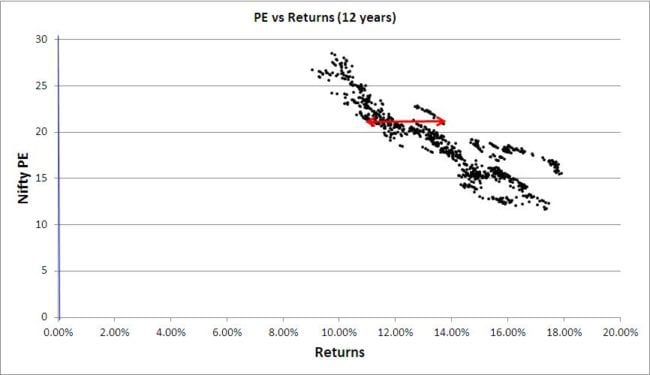
The correlation is stronger, but the number of data points have reduced significantly. Those who invested at PE levels of 25 and above, 12 years back would be sitting with a return of about 10%, while those who invested with Nifty PE less than 15 would have got about 15% or more.
Whether this is significant or not can be debated endlessly. As mentioned above, the case for not investing at high PE (~ 25) remains strong enough, whereas the case for investing only at low PE (< 15) has weakened, thanks to the wide range of returns possible.
Should one forget about all this and just do a mutual fund SIP? Not a bad idea at all.
Is SI-PE  worth it? well, yes and no.
Yes it makes sense not to invest when the PE is high. Yes it even makes sense to pull out a portion of the equity corpus when the PE is very high (> 25).
However, it also makes sense to get rid of the salary into an investment each month. So perhaps one can have a base SIP running and ‘time’ the additional amount according to the PE. Perhaps.
It all comes down to ones mental framework. If one can remain cool, calm and stop worry about the grass on the other side of the meadow, SI-PE will work.
If one gets worked up each time the PE increases by a few points, SI-PE is not worth it.
I do monthly manual investing and do try to invest on 1-2% market dips each month.
On the one hand, my monthly investment is high and my portfolio is getting fatter, meaning soon it will swing by 60K-100K over a few days if not over a day. So I cannot simply invest more or let the money lie around when the PE is high. I however have a lot of inertia and will not do this impulsively.
On the other hand, I am an investment junkie. Unless I put away my salary as soon as possible, I will feel restless. The money may or may not get spent, but I will quite uneasy. So I will need to balance this.
What I do may or may not be smart. It is my thing. You will have to figure out yours. If you are a ‘new’ investor stick to a SIP!