Tuesday, 30 December 2014

Investment Management Rules

Dear All.

Please find below a good article as appeared in AdvisorKhoj for your reading:

Investment Management Rules

A few days back I was speaking with an investor. He told me that he does not look at stock prices or mutual fund NAVs in his portfolio during bull markets. However, he pays close attention to stocks and mutual funds during market downturns. Market downturns, especially the sharp ones, present good buying opportunity. Market downturns also help him identify the solid performers and replace the relatively weak performers with the solid ones. Unfortunately most retail investors are not like this investor. In fact they do just the opposite. They get exuberant in bull markets and panic during corrections. If you belong to this group, remember it is natural human emotion. In fact, runaway bull and bear markets are caused by irrational exuberance and panic respectively. As an equity investor you should not be afraid of volatility. In this blog, we will discuss some rules to manage your investments in volatile markets.
  1. To be a successful investor, it is less about managing your investments in volatile markets and more about managing your own emotions. The first rule is not to panic in volatile markets. When we panic we are not thinking clearly and usually end up making the worst decision. However, it is easier said than done because getting worried when your investments lose value is only a natural human reaction. Therefore you need to make an effort to stay calm and focused. In psychological terms this is an attribute of emotional intelligence. You should understand the inherent characteristics of equity as an asset class. Volatility is an inherent characteristic of equities. Your investment may lose its value in a market downturn, but remember you still own the asset. Once you ride out the volatility your asset will again appreciate in value.

  2. Corrections present a good opportunity to invest, because you can buy assets at a relatively lower valuation. The recent market correction, thankfully it is over for the time being, had a few worried investors calling their brokers. However, the good thing about this correction was that, while FIIs sold, domestic investors bought in the market. If you have invested in mutual funds during this correction, you would have bought your units at 7% lower cost compared to the peak. The sharper the downturn, the better is the buying opportunity. Systematic Investment Plans (SIPs) is a great investment mechanism because it can help investors to take advantage of volatility by averaging out the cost of the units purchased. SIPs help investors stay disciplined during volatile markets and help you achieve your investment goals, irrespective of what the market is doing in the short term.

  3. Do not forget your asset allocation during volatile market conditions. Your asset allocation is governed by your risk tolerance and financial objectives. Run away bull markets or sharp prolonged corrections skew your asset allocation. For example, if your optimal asset allocation is 60% equity and 40% debt and the market appreciates 30% in a few months, your asset allocation will get skewed to 75% equity and 25% debt. This may not be consistent with your risk profile. In such a situation, you should rebalance your portfolio to shift from equity to debt. Similarly if the market falls sharply, your asset allocation will be skewed to debt. In such a situation, you should rebalance your portfolio by investing additional funds in equity or shift from debt to equity depending upon your financial situation.

  4. Volatile markets help you identify the solid performers from the weak performers. In a bull market everyone looks like a star. However, for your portfolio to give good returns in the long term you need your portfolio to be made up of consistent performers. As the legendary Warren Buffett famously said, “Only when the tide goes out do you discover who's been swimming naked”. Your equity fund may have given 30% return in the last one year, but has your fund manager delivered the returns by taking excessive risks. In a market downturn you will be able to evaluate which funds in your portfolio has more downside risk than upside risk, on a relative basis. It has been proven that consistent performers over a long time horizon give better returns than funds who give high returns in the short term. You should use a market downturn to separate out the solid performers in your portfolio from the relatively weak performers, and then reshuffle your portfolio to replace the weak performers with more consistent performers. But should not judge a fund based on just short term performance. You should evaluate how it is has performed over a period of time during both market rallies and downturns.

  5. Arbitrage funds are good short term investment options in volatile markets. Arbitrage funds are low risk investments and benefit from market volatility. In volatile markets, arbitrage funds can give higher returns than liquid funds, and certainly more returns than bank deposits. The added advantage of arbitrage funds is that the returns are tax free if they are held for a period of over one year.
Conclusion
In this article we have discussed some important rules to manage your investment in volatile market. Smart investment decisions taken in volatile market conditions can help you significantly enhance the return on your investment. More importantly, you should stay disciplined and stick to your investment plan. Remember equity investment is for the long term, so you should not be bothered with short term volatility.

Is risk synonymous with volatility? When an investor wants to understand risk, must he look at volatility?

Dear All,

Please find below a good article as appeared in MorningStar for your reading:

Is risk synonymous with volatility? When an investor wants to understand risk, must he look at volatility?

The term risk has different meanings for different people.
Ask an investor what comes to mind when talking about risk management, he will state that he does not wish to lose his money, or will want to know as to how much the return can potentially drop by.
Throw the same query to a finance professional and he will tell you that standard deviation is the measure of risk. So what he is saying is that risk is not defined as the likelihood of loss, but as volatility, which is determined using statistical measures of variance such as standard deviation and beta.
(Standard deviation is a measure of absolute volatility that shows how much an investment’s return varies from its average return over time. Beta is a measure of relative volatility that indicates the price variance of an investment compared to the market as a whole. The higher the standard deviation or beta, the higher the risk.)
So while professionals often use volatility as a proxy for risk, it does not measure what an investor intuitively perceives as risk.
It is more helpful to think of volatility as sudden price movements. Volatility encompasses the changes in the price of a security, a portfolio, or a market segment both on the upside and down. So it’s possible to have an investment with a lot of volatility that is moving one way: up (not always down).
Even more important, volatility refers to price fluctuations in a security, portfolio, or market segment during a fairly short time period—a day, a few weeks, a month, even a year. Such fluctuations are inevitable and come with the territory. If you are in for the long haul, volatility is not a problem and can even be your friend, enabling you to buy more of a security when it’s at a low ebb.
The most intuitive definition of risk, by contrast, is the chance that you will lose your principal investment and won’t be able to meet your financial goals and obligations. Or that you will have to recalibrate your goals because your investment kitty comes up short.
Having said that, it is easy to see how the two terms have become conflated. If you have a short-term horizon and you’re in a volatile investment like stocks, it could be downright risky for you. That’s because there is a real risk that you could have to sell out and realise a loss when your investment is at a low ebb.
The same investment with a long-term horizon throws up a completely different scenario. The very same stocks may not be all that risky if you bought them at bargain rates when compared to their intrinsic value and intend holding on to them for many years. However, you will have to contend with volatility which comes with the territory.
In 2008, the global crisis drove securities prices to especially low levels actually making them less risky investments. Indeed, Seth Klarman, one of the world’s most respected value investors, believes that risk is not inherent in an investment, it is always relative to the price paid. So in the midst of volatility and extreme uncertainty of 2008, the risk of investing in equity actually dropped.
Reactions to volatility are very often emotional. Investors buy and sell on reaction, or rather overreaction, to news and speculation without any significant consideration to long-term returns. Recall the sell-off of not just 2008 but even 2011 when volatility went through the roof. Now look at where the market is today. The volatility did not really affect the long-term returns of an investor who assesses risk in terms of long-term failure to meet a pre-determined outcome. Those who ignored the volatility and stayed are better off because of it.
Given this backdrop, defining risk as volatility runs counter to common sense. Do not assess risk and construct your portfolio based on the volatility of the ride. Investment risk is the possibility of suffering losses and its potential magnitude. Another indication of investment risk is the maximum drawdown from a previous high – peak to trough.
So how can investors focus on risk while putting volatility in its place? Come to terms with the fact that volatility is inevitable and if you have a long enough time horizon, you will be able to harness it for your own benefit. Secondly, invest in equity mutual funds via a systematic investment plan, or SIP, to ensure that you are entering the stock market in a variety of environments, whether its feels good or not. Finally, diversifying your portfolio among different asset classes and investment styles can also go a long way toward muting the volatility of an investment that’s volatile on a stand-alone basis.
These moves will make your portfolio less volatile and easier to live with.

Tuesday, 23 December 2014

The Permanent Portfolio: A Fascinating Low-Volatility Option For The Long Term Indian Investor?

The Permanent Portfolio: A Fascinating Low-Volatility Option For The Long Term Indian Investor?

 Worried about fluctuating stock market returns? Worried about sliding gold prices? Not sure how much to invest in equity or in gold? Here is an example of a portfolio based on an ingeniously simple notion that has proved to be remarkably stable irrespective of market conditions – stock/commodity/debt/currency markets!
The Permanent Portfolio in an alternative investing paradigm developed by Amercian investment adviser Harry Browne in 1981. The permanent portfolio comprises of stocks, bonds, cash and gold in equal  proportions (25%)!  This sounds bizarre because for long term goals most investment advisers would recommend (1) significant equity exposure. Typically 100-age. That is 65% equity allocation for a 35 year old and rest in debt. (2) little or no gold  exposure (not more than 10%)  (3) little or no cash.
How can such an unconventional portfolio allocation work for long term goals? The idea behind the permanent portfolio is fascinatingly simple. In his book, Fail-Safe Investing: Lifelong Financial Security in 30 Minutes, Browne writes about four possible economic conditions:
  • Cover of "Fail-Safe Investing: Lifelong F...Prosperity when markets do exceedingly well
  • Recession  a general slowdown in one or more aspects of the economy
  • Inflation No need to explain this one, right?!
  • Deflation Negative inflation. Believe it or not, has occurred in the past!
The idea of the permanent portfolio is to choose instruments which will do well in one or more of the above conditions. According to Browne these are:
  • Stocks When the markets do well. Direct equity or mutual funds. Even an index fund should do.
  • Cash during recession. For example a liquid fund
  • Gold during inflation
  • Long Term Bonds during deflation and prosperity
Thus the permanent portfolio is: 25% Stocks, 25% Cash, 25% Gold and 25% bonds. To ensure “an investor is financially safe, no matter what the future brings”. Read more: The Permanent Portfolio Allocation
An ideal portfolio should provide returns that beat inflation with low volatility. Low volatility here means the compounded annual growth rate (CAGR) at the end of each investment year should not vary too much from the final CAGR. Why low volatility? Too much volatility will kill the fruits of compounding, that is why. The permanent portfolio has measured up to these two requirements in the US quite impressively for the last 40 years! For details:Performance and Historical Returns
Will this approach work in India? An expert is likely to say no for several reasons. (1) India is an emerging economy and equity exposure should be higher than 25% for portfolio returns to beat inflation (2) gold is not an effective hedge for inflation (at least in India) (3)  ‘cash’ or liquid debt is unsuitable for long term growth. I am sure there are more. This is as far my thinking takes me. Feel free to add to this in the ‘comments’ section.
Why not check for ourselves? I  have simulated the performance of the permanent portfolio by considering historical Sensex, gold, fixed deposits (instead of bonds) and savings bank returns (instead of money market instruments or liquid funds). One could simply add 1-2% to the SB interest rate to make it resemble a liquid fund. The allocation is 25% in each category, rebalanced each year as noted by Browne in Fail-Safe Investing. You can use the attached Excel file to analyze the performance of the permanent folio for any and every duration between 1979 and 2012 for SIP and lump sum investments.
Short term performance: The permanent portfolio has not always produced great returns for short durations. If you have started a SIP in 2009 you would got an impressive CAGR of 13.62%  3 years later. However if you had started it in 2000, you would have got only 2.2% 3 years later.
Five year returns are a little better. All investments made since 2000 would have yielded impressive double digit returns while investments started between 1992 and 1999 would have  yielded dismal returns. If there is a period in time when multiple asset classes under perform simultaneously (for example gold and stocks in the mid 90s) the permanent portfolio fails to impress for short durations. Nothing to shout about though.The investing paradigm is not meant for short term investing (in my view!).
Long term performance: As the investment duration becomes longer, the benefits of the investment portfolio become clearer.  The average CAGR of every possible 15 year SIP  between 1979-2012 is an impressive 11.2% However SIPs started between 1986 – 1992 would have got only singe digit returns (lowest of 7.8% for a 15 year SIP started in 1986).
When the investment duration is increased to 20 years almost every duration has a double digit return or close to it (the lowest is 9.51%). For a 25 year duration the average CAGR is 11.2%. There are a total of nine 25 periods between 1979-2012. The highest CAGR is 11.48% and the lowest is 10.7%.
Thus for long investment durations (typically more than 20 years!) the permanent portfolio offers a return which is nearly independent of when you start the investment.
Notice the low volatile, steady performance of the permanent portfolio (green line)
Notice the low volatile, steady performance of the permanent portfolio (green line, right axis).
The most important feature of the permanent portfolio is its low volatility. That is the CAGR at the end of each investment year does not vary too much from the final CAGR. For example a lump sum investment in the permanent portfolio started in 1987 would have yielded a CAGR (geometric mean) of 11.9%. The arithmetic mean is 1.4% more than the CAGR. This difference between the two means can be considered as a measure of volatility.
If we compare this to a more common asset allocation in which we use 70% equity exposure and 30% debt (FD) exposure, the same lump sum investment started in 1987 would have yielded a CAGR of 15.1% for annual rebalancing. The volatility however is 3%. Thus the yearly returns of a permanent portfolio fluctuate considerably lower than a typical long term portfolio. Lower returns is the price one must pay for this low volatility. You can play with this rebalancing simulator to gauge the performance of conventional equity:debt portfolios.
Note: In the simulation I have used a SB account and added 2% to it so that returns resemble that from a liquid fund. This is not really necessary since it does not make a significant difference to long term returns.
What about risk? Assuming that the permanent portfolio minimizes volatility for long term investments, we need to consider risk. For long term investments the risk of importance  isloss of value. That is the returns should comfortably beat inflation in order for any corpus to be effective. In this regard I am not too sure about the performance of permanent portfolio. While it does provide consistent returns of 10-11% for durations above 20 years or so, it is important to recognize that I have not included taxes in the calculation. I would think post-tax returns would hover around 8-9% for a net 11% pre-tax return. This just about equals inflation. Not a bad performance at all, but not great either.Not great because such a return may or may not be sufficient for a financial goal. It certainly good enough for someone with a frugal lifestyle with retirement 25 years awayA long term (~ 15 years) portfolio with (100-age)% in equity still remains the best bet (historically) for comfortably beating inflation.
So why bother? The Indian investor should take the permanent portfolio seriously for several reasons:
  • It is a good option for the investor with a volatile temperament. Many investor get jittery and all worked up when equities do badly for many years together. The (100-age) equity exposure formula may not be well suited for such investors. Panic is likely force them make dramatic mistakes and kill the power of compounding. The permanent portfolio with limited exposure in equity (and gold!) maybe better suited for such investors. Of course I am assuming such people look at the overall portfolio growth and not at individual asset classes! A little too much to expect?
  • It is a fantastic illustration of how proper diversification can protect a portfolio. In the 2008 market crash the permanent portfolio fell only by a remarkable ~ 2%!  The % allocation to each asset class need not be 25%. The key is to choose asset classes with little or no correlation in performance.
  • It seems like a good option for someone in their mid-20s planning for retirement at 60.
  • It is certainly a good option for the contended investor. Someone who does not worry about what returns others are making (others refer to friends and asset classes!). Someone who is clear about what return is required for his/her goals.
  • As the Indian market evolves and (assuming) the economy develops, the gap between actively managed funds and index funds should narrow. Under such circumstances the permanent portfolio should offer much more consistent returnsrivaling long term equity returns.
Who is it not for? It is certainly not for those constantly obsessed with returns. Not for those who wish to ‘build wealth’ (someone please explain to me what that means). Not for those who question the 25% allocation: Since gold has crashed, why should I not increase exposure in gold now? If I maintain 25% exposure in equity at all times? Will I not miss out on chances to invest more during market crashes?
Implementation: There are many ways in which a permanent portfolio can be constructed. Ways which are far more rewarding and maybe tax efficient than the one I have used for the simulation:
  • 25%  good large cap fund, 25% gold etf, 25% ‘income’ debt fund and 25% ‘liquid’ fund. (1/4 asset classes has no long term capital gains tax)
  • 25% good large cap fund, 25% gold etf, 25% ‘income’ debt fund and 25% arbitrage fund. (2/4 asset classes has no long term capital gains tax)
  • 15% good large cap fund, 10% good mid-cap fund, 25% gold etf, 25% ‘income’ debt fund and 25% ‘liquid’ fund
  • Can you suggest ways in this can be done better?
What do you think about the permanent portfolio? Do you think it is suitable for Indian retail investors?
Download the permanent portfolio simulator: Indian Edition
Resources:

Simple Steps to De-risk Your Investment Portfolio May 28

Simple Steps to De-risk Your Investment Portfolio

 
The recent upward swing in the markets has left most people happy. Some are excited because they have never seen wealth grow at such a frantic pace and some are just happy – happy that their convictions and time in the market has paid off.
While current market valuations are still on the reasonable side (Nifty PE ~ 20.2 and CNX 500 PE ~ 20.7) and one can still invest, to gain from this upward movement we must go easy on the euphoria and train our minds to become fearful.
Yes fearful – As Waren Buffett said be greedy when others are fearful and fearful when others are greedy.
While most investors are dreaming about this bull run and how it will create wealth for them, ones time is better spent in learning how to reduce risk in ones portfolio.
The key aspect of investing in volatile instrument is not gains but preservation of gains.
All well to the ride the bull and enhance portfolio value. If the market corrects, your folio should correct less – much less.
That is the secret to wealth building – reduce the volatility in portfolio returns but at the same time keep the net return well above expectations.
Accomplishing this is easier than you think or anyone might lead you to think!
Here are some simple steps to de-risk your investment portfolio

1. Start investing early 

Boring as it may sound, there is no better way to lower risk than beginning early. The more time you have in your hands, the more time you will have to recover. So start investing asap.
In the simple compound interest equation,
Value = investment x (1+ return) duration,
Duration and quantum of investment (not returns) are responsible wealth creation. So ensure you maximise both.

2. Expect less 

This is the most important step in de-risking. The lower your return expectations, the lower the risk.
Investors who want a minimum of 20% return from their equity portfolios will have to take a lot more risk than investors who only want 10%.
The long term return from Indian equity markets  is not the 15% that everyone says it is. That number is heavily influenced by the Harshad Mehta scandal.  If no such scandal occurs, the long term return drops to 10% (see how here).
So we need to be realistic in our expectations. This is vital in keeping us calm.
Remember we pose the biggest risk to our folios! So the calmer we are, safer the folio.
Most investors become jittery because they fail to understand how equities ‘compound’. We expect 10% long-term returns from equities. This means one should not expect 10% year after year in investment.
Some years will be good, some excellent and some terrible. What you get is the net effect:
Value = investment x [(1+ good return) x (1+ terrible return) x (1+ excellent return) x…… ]duration
So the key is to stay the course.

3. Asset allocation

Naturally, one cannot afford to be in 100% equity. The terrible return would then negate the effect of the good returns, and one would be left with nothing.
The only logical solution is to limit the fluctuations in the portfolio returns due to swings in equity return.
Therefore, one must include safer assets like (debt instruments) bonds to reduce the overall risk to the folio.
Here safety  refers to the poor correlation between the movements of equity markets with debt markets. Fluctuations in one will little affect the other.
How much should the equity:debt proportion be depends entirely on the goal duration and nature. Here is an example
Returns indicated are before taxes!

4 Choose wisely

Conservation asset allocation and return expectations are important but about to nothing if the right kind of investments are chosen.
The simplest and most important measure of risk investors must understand is thestandard deviation – a measure of how much a set of returns deviation from their average.
Lower the standard deviation, lower the risk.
The first step is to choose the right category of instruments. Here is a step-by-step guideto help you do that.
As a general thumb rule, lower the investment duration, lower should be standard deviation of the instrument.
For example, choosing an equity oriented balanced fund for a 5-year investment duration is madness.

 5 Diversify

Asset allocation represents diversification across asset allocation. One should also diversify within an asset class. For example equity holdings should be spread across market cap, sectors, nature of stocks and geography.
Diversification is the second most important step (expecting less is the first). Use this toolto find out how diversified your equity mutual funds are.
A well-diversified portfolio with reasonable expectations will significantly reduce downside risk.
These are mandatory requirements of any investor.

 6 Rebalancing

One can do a little better. You start with some asset allocation in mind. With time gains or losses in individual instruments will skew the allocation and it begin to deviate.
For example, a 60:40 equity:debt investments started a year ago could easily be 65:35 or 70:30 because of the upward swing in the equity market.
If this skewed allocation is reset to 60:40 by pushing some amount from the equity folio to the debt folio, the gains made in a volatile asset (equity) are shifted to a less volatile asset (debt) thereby preserving them.
This is known as rebalancing. There are several ways to do this. Learn more here.
Check out this volatility simulator to understand how rebalancing can be used to de-risk a folio and enhance gains.
Rebalancing requires no special know-how. All it requires is discipline. The discipline to shift capital from a well performing asset class to a safer one!
Rebalancing is not  profit booking.

 7 Tactical asset allocation

All of the above mentioned points can be (and should be!) implemented by all retail investors on their own.
The following, although not difficult to understand is recommended only for experienced investors with big folios.
When markets rise, they will soon become overvalued. Stocks will be priced higher than they are worth and one can expect prices to fall … sooner or latter.
A simple indicator market valuation is the P/E ratio or the price/earnings ratio.
Tactical asset allocation can be implemented many ways. For example,
1) when PE value is high, say > 22, stop investments, accumulate them and invest when the PE value becomes lower, say < 18. Read more about this here
2) when PE is high, say >22, stop investment and shift to debt. Move back and resume investment when PE value become lower. Read more about this here
This requires even greater discipline than rebalancing and extra-ordinary level headedness.  For example, the markets could increase after we pull out. If we are ones who tend to regret and lose focus, this is not for us.
Tactical asset allocation is for those who are focussed on the net portfolio returns.
Tactical asset allocation is not  profit booking.

8 Quit while ahead

Equity holdings should be decreased gradually as the goal approaches. Two – three  years before the deadline, the portfolio should be in pure low volatile debt instruments with no equity.
This means the last two years, the returns would be much smaller than your overall expectations. A simple way to account for this while planning for goals is to reduce the duration by two years.
If your child’s education goal is 14 years away, assume it is 12 years away. Therefore, two years before the actual goal date, much of the corpus is accumulated, and can be kept away safely.
There is no need to this while  planning for retirement, provided one started early and invested enough. Do you know why?
~~~~~~~~~
With these simple guidelines –most of which is commonsense – one can de-risk the portfolio effectively, remain calm and focused, paying little or no attention to the current state of the market.

My Favourite Movies on Finance Dec 13

My Favourite Movies on Finance

 
Here is a list of my favourite movies with a financial theme.  This is an off-beat listing and I have deliberately avoided movies with the words Wall Street in them!  I have not listed trading based movies or business oriented movies like, The Insider, Barbarians at the Gates and many documentaries centered around Wall street or the 2008 crash. I am yet to see, the inside job. So it is not here.
I have also not listed many foreign language films (French, Korean etc.) which have a financial theme, for I have not watched any as yet.
This is not an exhaustive list of my favourites. When  I ask myself to make a list, many wonderful movies escape my memory. This is all I could muster. All posters are from Wikipedia and all storylines and from IMDB.
Feel free to list your favourite finance themed movie in the comments section.
All posters are from Wikipedia and all storylines and from IMDB.

Double Indemnity (1944) – Life Insurance

Storyline:  An insurance rep lets himself be talked into a murder/insurance fraud scheme that arouses an insurance investigator’s suspicions.
An extraordinary jaw-dropping film noir which has not its sheen one bit. Might make you a bit paranoid about how the claims settlement department works though!
Double indemnity.jpg

It’s a wonderful life (1946) – Real Estate Loans

Storyline: An angel helps a compassionate but despairingly frustrated businessman by showing what life would have been like if he never existed.
Features my favourite actors James Stewart and Donna Reed. Saw it for the first time more than 20 years ago. When the movie ended, I locked myself in the bathroom and sobbed inconsolably in joy! A truly cathartic experience. It is a holiday season fav. So it should play in Star Movies this month.
Its A Wonderful Life Movie Poster.jpg

Margin Call (2011) – Value At Risk

Storyline: Follows the key people at an investment bank, over a 24-hour period, during the early stages of the  (2008) financial crisis.
Not exactly a classic but I saw it at a time when I had given up on movie watching and it revived the habit for me. So it is special.
Margin Call.jpg

Arbitrage (2012)  –  price convergence

Storyline: A troubled hedge fund magnate desperate to complete the sale of his trading empire makes an error that forces him to turn to an unlikely person for help.
Many people believe that the title is incorrect and confusing, but I think it is absolutely brilliant.

Arbitrage 2012 Poster.jpg
Glengarry Glen Ross (1992) Real Estate, Salesmanship

Storyline:  An examination of the machinations behind the scenes at a real estate office.
Extraordinary movie about selling pressure. A favourite.

Glengarrymovie.jpg

The Pursuit of Happiness  (2006)

Storyline:  A struggling salesman takes custody of his son as he’s poised to begin a life-changing professional endeavor.
Not exactly a ‘finance’ movie but shows the struggles of a driven man  with a dream, who has trouble meeting ends.
Poster-pursuithappyness.jpg

The Shawshank Redemption (1994) – Ashal Jauhari

Storyline: Two imprisoned men bond over a number of years, finding solace and eventual redemption through acts of common decency.
Don’t ask me why, but this movie remains me of Ashal Jauhari! It is the second most cathartic movie I have ever seen (Its a wonderful life, is the first, the dark knight is the third).
ShawshankRedemptionMoviePoster.jpg
I will stop here with an uneasy feeling that this list is woefully incomplete.

Moving Average Market Level Indicator Dec 16 bypattu Use this moving average calculat

Moving Average Market Level Indicator

 
Use this moving average calculator to get an approximate quantitative estimate of current market levels.  It calculates two moving averages  (over durations that can be varied by the user) of  30+ BSE and NSE market indices.
My aim in making this tool is to get an idea of long-term market trends following the method described by Jim Otar in his ‘Hurricane Warning Chart’
The sheet will not allow you to exit the at the top and enter at the bottom.
DISCLAIMER :
  • Do not use this as a trading tool
  • Do not make investment decisions based on this data alone. This is a sheet made out of academic interest.
  • Recognise that understanding moving average movements will take time and you will need to develop your own interpretations.
A moving average or a simple moving average is a technical  analysis tool in which the actual index data is compared with its average taken over a period of time.
For example, a monthly moving average is one in which the monthly return is calculated, with the duration rolled over by one business day.
For example, if you have data between 1st Jan 1990 to present,
You would calculate the average index value between 1st Jan 1990  – 30th Jan 1990, then between 2nd Jan 1990 – 31st Jan 1990, then 3rd Jan 1990 – 1st Feb 1990 and so on.
The average data is plotted with the end-date of the interval (30th Jan, 31st Jan, 1st Feb ….).
In my investment strategy analysis of IDFC Dynamic Equity Fund, I had shown the 200 day daily moving average of the Nifty.
When the Nifty is above the 200-DMA, it represents an upward trend and when the Nifty is below the 200-DMA, it represents a downward trend. In a sideways market, the Nifty could repeatedly cross the DMA either way.
Jim Otar suggests the following with two DMAs:
1) 5-month DMA (blue line)
2) 12-month DMA (red line)
Bearish trend: If the blue line goes below the red line, when the red line is heading south (red arrows below)
Bullish trend: If the blue line goes above the red line, when the red line is heading north (green arrows below)
This is the result for the CNX Nifty
Moving Average Calculator Nifty

As mentioned above, moving averages do not allow you to catch market peaks and bottoms exactly but gives an overall trend, which I think will help limit portfolio volatility for the long-term investor at least from an emotional perspective.
Is this relevant for mutual fund investors? Should we not let the fund manager take calls for us?
Perhaps, yes. But fund managers may or may not be able to exit equity whenever they want. So I think it is up to the investor to take some tactical calls in moderation.
Download the moving average market level Indicator

SIP Rolling Returns Analysis with Sensex Data Sep 18 by pattu

SIP Rolling Returns Analysis with Sensex Data

 
No matter how often we mention/promote/advertise that equity investments if continued over a long enough period would generate handsome returns, many investors seem to require constant reassurance and encouragement to continue their equity investments.
A person who wishes to remain anonymous made the following SIP rolling returns analysis with Sensex data to provide his friends this reassurance and encouragement.  He readily and most generously agreed to share his analysis but chose to remain anonymous:(
The analysis
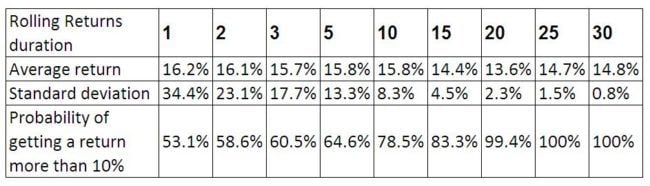
Assuming a SIP investment in an index mutual fund that tracks the Sensex, rolling return averages have been approximately calculated for 1, 2, 3, 5, 10, 15, 20, 25 and 30 year periods.
For data ranging from April 1979 to Aug. 2013 there would be as many as 53 periods of 30 year duration separated by a month!  For example, April 1979 to 2009 is the 1st period, May 1979 to May 2009 the 2nd period and so on.
Part of the results are tabulated below
Results of SIP Rolling returns analysis with Sensex data
Notice how the average* SIP return varies only by about 2%.  This however, has no meaning unless we look at the standard deviation.  (* average here is the arithmetic average of all rolling return data)
Standard deviation, as mentioned before is a measure of how much the actual results can vary from the average, assuming that the data points follows a normal distribution (a very good introduction to normal distributions may be found here).
A more endearing definition:
The average 1 year rolling return is 16%. The standard deviation is 34%. This means 68 times out of 100, the return you get will be anywhere between 16% -34% to 16%+34%.
This just means over a one-year period, the return could just about be anything!
Contrast this with the data for a 20-year rolling return.  Over this duration, 68 times out of 100 the return you get will be anywhere between 13.6%-2.3% to 13.6%+2.3%
That is the range of fluctuations in the returns has come down significantly when the investment tenure is longer. In the table, you can see that the standard deviation drops to 1-2% for a tenure of 20 years or more.
The increase in probability of getting more than 10% return with increase in investment tenure is a consequence of the decrease in standard deviation.
Bottomline: If we start a SIP in a diversified equity mutual fund for a long-term goal a good 15-20 years away and never stop it, the chances of us getting a double-digit return is reasonably high.  The simplest example of such a fund is an index fund as assumed in this analysis.
Take-home message:
Equity investments are capable of producing high returns only because they are volatile.  The only way to take advantage of fluctuating returns is to stay invested.
That way the fluctuations become much smaller than the average return (more on this later).
That is the geometric average of fluctuating returns when considered for a long enough period is high with a small standard deviation.  To put it plainly the net return is high!
Download the SIP Rolling Returns analysis with Sensex data
(It also includes a lump sum analysis)
If you wish to learn more about volatility you could try out these calculators:
Portfolio Rebalancing –Volatility Simulator
Debt Fund vs. FD –Volatility Simulator
Credits:
As mentioned before, this analysis was made by a person who wishes to remain anonymous.  Please join me in thanking him for his generosity.
Do share your thoughts on this analysis.