Tuesday, 23 December 2014

My Favourite Movies on Finance Dec 13

My Favourite Movies on Finance

 
Here is a list of my favourite movies with a financial theme.  This is an off-beat listing and I have deliberately avoided movies with the words Wall Street in them!  I have not listed trading based movies or business oriented movies like, The Insider, Barbarians at the Gates and many documentaries centered around Wall street or the 2008 crash. I am yet to see, the inside job. So it is not here.
I have also not listed many foreign language films (French, Korean etc.) which have a financial theme, for I have not watched any as yet.
This is not an exhaustive list of my favourites. When  I ask myself to make a list, many wonderful movies escape my memory. This is all I could muster. All posters are from Wikipedia and all storylines and from IMDB.
Feel free to list your favourite finance themed movie in the comments section.
All posters are from Wikipedia and all storylines and from IMDB.

Double Indemnity (1944) – Life Insurance

Storyline:  An insurance rep lets himself be talked into a murder/insurance fraud scheme that arouses an insurance investigator’s suspicions.
An extraordinary jaw-dropping film noir which has not its sheen one bit. Might make you a bit paranoid about how the claims settlement department works though!
Double indemnity.jpg

It’s a wonderful life (1946) – Real Estate Loans

Storyline: An angel helps a compassionate but despairingly frustrated businessman by showing what life would have been like if he never existed.
Features my favourite actors James Stewart and Donna Reed. Saw it for the first time more than 20 years ago. When the movie ended, I locked myself in the bathroom and sobbed inconsolably in joy! A truly cathartic experience. It is a holiday season fav. So it should play in Star Movies this month.
Its A Wonderful Life Movie Poster.jpg

Margin Call (2011) – Value At Risk

Storyline: Follows the key people at an investment bank, over a 24-hour period, during the early stages of the  (2008) financial crisis.
Not exactly a classic but I saw it at a time when I had given up on movie watching and it revived the habit for me. So it is special.
Margin Call.jpg

Arbitrage (2012)  –  price convergence

Storyline: A troubled hedge fund magnate desperate to complete the sale of his trading empire makes an error that forces him to turn to an unlikely person for help.
Many people believe that the title is incorrect and confusing, but I think it is absolutely brilliant.

Arbitrage 2012 Poster.jpg
Glengarry Glen Ross (1992) Real Estate, Salesmanship

Storyline:  An examination of the machinations behind the scenes at a real estate office.
Extraordinary movie about selling pressure. A favourite.

Glengarrymovie.jpg

The Pursuit of Happiness  (2006)

Storyline:  A struggling salesman takes custody of his son as he’s poised to begin a life-changing professional endeavor.
Not exactly a ‘finance’ movie but shows the struggles of a driven man  with a dream, who has trouble meeting ends.
Poster-pursuithappyness.jpg

The Shawshank Redemption (1994) – Ashal Jauhari

Storyline: Two imprisoned men bond over a number of years, finding solace and eventual redemption through acts of common decency.
Don’t ask me why, but this movie remains me of Ashal Jauhari! It is the second most cathartic movie I have ever seen (Its a wonderful life, is the first, the dark knight is the third).
ShawshankRedemptionMoviePoster.jpg
I will stop here with an uneasy feeling that this list is woefully incomplete.

Moving Average Market Level Indicator Dec 16 bypattu Use this moving average calculat

Moving Average Market Level Indicator

 
Use this moving average calculator to get an approximate quantitative estimate of current market levels.  It calculates two moving averages  (over durations that can be varied by the user) of  30+ BSE and NSE market indices.
My aim in making this tool is to get an idea of long-term market trends following the method described by Jim Otar in his ‘Hurricane Warning Chart’
The sheet will not allow you to exit the at the top and enter at the bottom.
DISCLAIMER :
  • Do not use this as a trading tool
  • Do not make investment decisions based on this data alone. This is a sheet made out of academic interest.
  • Recognise that understanding moving average movements will take time and you will need to develop your own interpretations.
A moving average or a simple moving average is a technical  analysis tool in which the actual index data is compared with its average taken over a period of time.
For example, a monthly moving average is one in which the monthly return is calculated, with the duration rolled over by one business day.
For example, if you have data between 1st Jan 1990 to present,
You would calculate the average index value between 1st Jan 1990  – 30th Jan 1990, then between 2nd Jan 1990 – 31st Jan 1990, then 3rd Jan 1990 – 1st Feb 1990 and so on.
The average data is plotted with the end-date of the interval (30th Jan, 31st Jan, 1st Feb ….).
In my investment strategy analysis of IDFC Dynamic Equity Fund, I had shown the 200 day daily moving average of the Nifty.
When the Nifty is above the 200-DMA, it represents an upward trend and when the Nifty is below the 200-DMA, it represents a downward trend. In a sideways market, the Nifty could repeatedly cross the DMA either way.
Jim Otar suggests the following with two DMAs:
1) 5-month DMA (blue line)
2) 12-month DMA (red line)
Bearish trend: If the blue line goes below the red line, when the red line is heading south (red arrows below)
Bullish trend: If the blue line goes above the red line, when the red line is heading north (green arrows below)
This is the result for the CNX Nifty
Moving Average Calculator Nifty

As mentioned above, moving averages do not allow you to catch market peaks and bottoms exactly but gives an overall trend, which I think will help limit portfolio volatility for the long-term investor at least from an emotional perspective.
Is this relevant for mutual fund investors? Should we not let the fund manager take calls for us?
Perhaps, yes. But fund managers may or may not be able to exit equity whenever they want. So I think it is up to the investor to take some tactical calls in moderation.
Download the moving average market level Indicator

SIP Rolling Returns Analysis with Sensex Data Sep 18 by pattu

SIP Rolling Returns Analysis with Sensex Data

 
No matter how often we mention/promote/advertise that equity investments if continued over a long enough period would generate handsome returns, many investors seem to require constant reassurance and encouragement to continue their equity investments.
A person who wishes to remain anonymous made the following SIP rolling returns analysis with Sensex data to provide his friends this reassurance and encouragement.  He readily and most generously agreed to share his analysis but chose to remain anonymous:(
The analysis
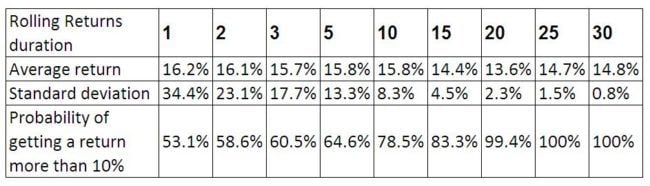
Assuming a SIP investment in an index mutual fund that tracks the Sensex, rolling return averages have been approximately calculated for 1, 2, 3, 5, 10, 15, 20, 25 and 30 year periods.
For data ranging from April 1979 to Aug. 2013 there would be as many as 53 periods of 30 year duration separated by a month!  For example, April 1979 to 2009 is the 1st period, May 1979 to May 2009 the 2nd period and so on.
Part of the results are tabulated below
Results of SIP Rolling returns analysis with Sensex data
Notice how the average* SIP return varies only by about 2%.  This however, has no meaning unless we look at the standard deviation.  (* average here is the arithmetic average of all rolling return data)
Standard deviation, as mentioned before is a measure of how much the actual results can vary from the average, assuming that the data points follows a normal distribution (a very good introduction to normal distributions may be found here).
A more endearing definition:
The average 1 year rolling return is 16%. The standard deviation is 34%. This means 68 times out of 100, the return you get will be anywhere between 16% -34% to 16%+34%.
This just means over a one-year period, the return could just about be anything!
Contrast this with the data for a 20-year rolling return.  Over this duration, 68 times out of 100 the return you get will be anywhere between 13.6%-2.3% to 13.6%+2.3%
That is the range of fluctuations in the returns has come down significantly when the investment tenure is longer. In the table, you can see that the standard deviation drops to 1-2% for a tenure of 20 years or more.
The increase in probability of getting more than 10% return with increase in investment tenure is a consequence of the decrease in standard deviation.
Bottomline: If we start a SIP in a diversified equity mutual fund for a long-term goal a good 15-20 years away and never stop it, the chances of us getting a double-digit return is reasonably high.  The simplest example of such a fund is an index fund as assumed in this analysis.
Take-home message:
Equity investments are capable of producing high returns only because they are volatile.  The only way to take advantage of fluctuating returns is to stay invested.
That way the fluctuations become much smaller than the average return (more on this later).
That is the geometric average of fluctuating returns when considered for a long enough period is high with a small standard deviation.  To put it plainly the net return is high!
Download the SIP Rolling Returns analysis with Sensex data
(It also includes a lump sum analysis)
If you wish to learn more about volatility you could try out these calculators:
Portfolio Rebalancing –Volatility Simulator
Debt Fund vs. FD –Volatility Simulator
Credits:
As mentioned before, this analysis was made by a person who wishes to remain anonymous.  Please join me in thanking him for his generosity.
Do share your thoughts on this analysis.

Nifty at 10000 in 12 months

Nifty at 10000 in 12 months?

 
Nifty at 10000 in a year? Before the next budget? Pretty sure most of you must have seen such headlines somewhere.  Here is a layman’s attempt at trying to figure out if these projections make any sense.

Nifty  vs. EPS YoY Growth Rate

First let us look at the way in which Nifty earnings per share (EPS) has grown year on year (YoY). To calculate this, first the EPS is computed (closing price divided by index PE) and then the growth rate is rolled over 1 year intervals.
Nifty-at-10000

Notice that the EPS growth rate (right axis) has been quite range bound in the last 5 years.   Looking at past growth rates during rallies, it seems to me that the rate at which Nifty has risen in the past 12 months is not as rapid as one would suggest. The rise is a sight for sore eyes, but one cannot trust sore eyes to make sound judgement.

Nifty EPS vs. Nifty PE

2-Nifty-at-10000

The nifty EPS (left axis) has pretty much increased at a steady pace of about 12% per year since Sep. 2002, barring the period during the 2008 crash and recovery.  More on this here: State of the Markets – April 2014
So I think one can safely project it for the next 12 months, assuming the same rate of growth (red line).
The EPS on Sep. 16th 2014 is ~ 376.
Projected EPS on Sep. 16th 2015 is ~ 397. Let us make it an even 400.
This corresponds to an EPS growth rate of about 6%.
This is perhaps a little too conservative estimate, but let us run with it.
Now if the Nifty touches 10000 on 16th Sep. 2015 for the first time,  the PE corresponding to an EPS of 400, will be 25.
Meaning: close to what experts would call, “extremely high valuations”.
Therefore, if the Nifty hits 10000 in the next 12 months with an annual EPS growth rate of less than 10%, the PE will become dangerously high. Meaning the so called ‘bull run’ will sooner or later come to crashing halt.
If the Nifty has to breach 10000, and  stay there for a decent amount of time,  the PE will have to be much lesser than 25.
If we assume the PE in a year to be about 22 with Nifty at 10000, the EPS has to be ~ 450.
This means that the EPS has to  grow by 20% from what it is today (16th Sep.).
Since the EPS has grown only by 8% in the last year, I am not too optimistic that there would be such a sudden surge in growth.
The current PE is ~ 21 (10Y average ~ 18.9). So even if the Nifty is at 10000, the PE is likely to be much higher than 22 as assumed above.
Let us hope/pray that I am proved wrong and that the Nifty comfortably breaches 10000 in a year and heads further northward :)

Update: Nifty Valuation analyzer – rolling standard deviation

Update: Nifty Valuation analyzer – rolling standard deviation

 
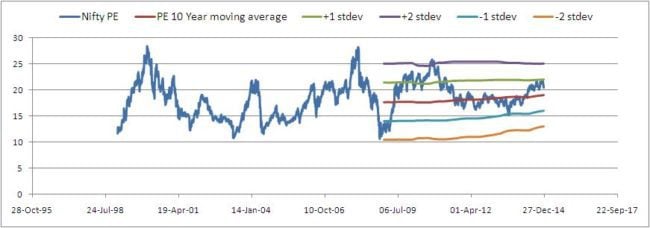
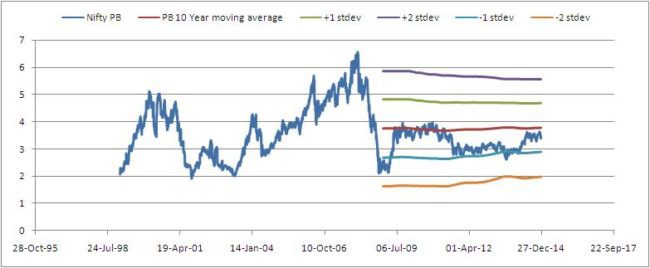
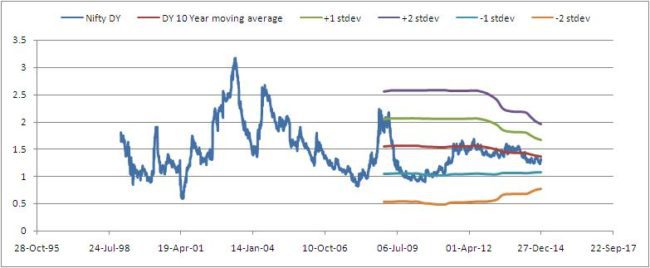
The Nifty valuation analyzer now has rolling standard deviation(stdev) curves plotted along with the rolling average PE, PB and Div yield curves.
As pointed out by Ravi Vooda, the
  • mean + stdev, and mean + 2*stdev,
  • mean – stdev, and mean – 2*stdev
curves might give a better picture of the market valuation.
Here are some results

Nifty PE

Nifty-analyzer-6

Nifty PB

Nifty-analyzer-7

Nifty Div. Yield

Nifty-analyzer-8

Notice that the standard deviation is more sensitive than the average to time. That is changes more rapidly as the days advance.  So while one can assume that the Nifty is dangerously overvalues when the PE and/or PB exceeds two standard deviations above the average, we must also recognise that the standard deviation and the average are changing with time.  So our assumption could be wrong.
I would like to make it clear that my interest in such analysis is only to find out dangerous valuations. There is no point in either not investing or pulliing out when the Nifty breaches, say  22.  As pointed out here

State of the Markets – April 2014

State of the Markets – April 2014

 
Are we at the start of a bull run?  Will the markets tank after elections? Should we book profits now, while the going is good? Should I invest now or wait after the election results are announced?
Such questions are on everyone’s mind. While dealing with volatile instruments like equity, some amount of tactical nous is necessary after a few years of investing to preserve the fruit of compounding. So while such questions are quite pertinent do not expect quant.-based answers to be far removed from commonsense and state what you would like to hear!
While someone who has just started mutual fund investing must continue their SIPs, someone with 5-6 years of experience will have to analyse the state of the markets every time there is a significant gain or loss in their equity or debt folio and respond appropriately. Including doing nothing!
This is an attempt by an non-expert to analyse the state of the markets with available information.
Nifty vs. Nifty Earnings Per Share
Using the definition of the price-to-earning ratio,
PE = Market Price per Share / Earnings per Share
We can calculate the Nifty Earnings per share from the Nifty closing value and Nifty PE. This is a crude estimate without considering the individual EPS values of the constituents.
State of the markets Nifty EPS
Notice the rather smooth increase in EPS when observed over a long period.
From about 2003 to the present, with the exception of the 2008 crisis, the EPS has increased approximately linearly. In the region covered by the blue line, the rate of growth has been 12%.
This can be thought of as the ‘historical’ long term returns from equity. Expecting more than this from your equity mutual funds is not a smart idea.
Of course the annual EPS growth (annual percentage change) fluctuates quite a bit.
State of the markets Nifty EPS growth
Clear from the table that in the recent past, EPS growth is a far cry from the bull run seen in the 2000s
Plotting the EPS using Nifty and Nifty PE tells us that the market is rewarding long term investor at a consistent rate regardless of short term instability and sideways movement. So whether you adopt tactical asset allocation or believe in averaging market movements with a SIP, you will be able to beat inflation.
Nifty vs. Nifty PE
With that piece of (obvious!) gyan behind us, let us look at the Nifty vs the Nifty PE.State of the markets Nifty PE
The long term Nifty PE movement is about 45-50% correlated with the Nifty. In the last year, this correlation is as high as 86%!
So looking at the Nifty PE alone can provide us decent insight into the state of the stock market.
Notice that the Nifty PE has remained relatively flat recently while the index has moved up. This means that the despite the recent rally the marker is neither undervalued or overvalued.
Nifty PE vs. Nifty EPS Growth (rolling annual % gain)
The EPS growth reflects the flat nifty suggesting that the present gains in the index is not part of a rally as historically, rallies have been accompanied with a sharp rise in EPS growth.
State of the markets EPS growth vs PE
So just because markets have improved for a month, removing capital now from your holdings in the name of booking profit is not a smart idea. If one must shift some gains that it has to be backed by solid logic.
Continuing SIPs is always a smart idea! (don’t need the graphs to establish that!)
If you have a lump sum to invest, should you do invest now or after the elections?
My view is, if there is not a single majority (a strong possibility because of the state politics), the markets would tank yes, but only temporarily. Even with a coalition govt, I expect the markets to rally in a few months time.
If there is a strong majority, the markets might soar but then in a few months time, normalcy would return.
Therefore, for lump sum investments, now or a couple of months later would not make a big difference over the long term.
If you have been investing for a while and if your portfolio has become lopsided by more than 5% because of the gains in equity, it would make sense to shift some of it to debt. Only some of it. Keeping in mind the tenure of the goal and its asset allocation.
This kind of profit booking is known by a more ‘decent’ name – rebalancing! If you wish to know more about this, suggest you start here.
At the end of the day, market movements are largely based on sentiments and hunches. When elections were announced, the markets reacted to the possibility of a strong govt but at the same time seems to be worried considering the different political equations at play.
The best quantitative indicator of ‘market sentiment’ is the Nifty Volatility index: India VIX
India VIX vs. Nifty PE
India VIX Nifty PE
Notice that India VIX has risen much more sharply than the Nifty PE in last month or so. That is the market is expected to be volatile in the next 30 days. So do not expect too much of a rally in this period.
Meanwhile, the 10-Year G-sec rates have increased! From 8.812% on Mar. 9th2014 to 9.104% on April 7th 2014.
Correspondingly the 1-year G-sec rates have decreased. From 8.913% on Mar. 9th 2014 to 8.654%  on April 7th 2014.
Thus the difference between 10-Y and 1-Y debt securities has widened.
The value of a bond has an inverse relationship with interest rate. If long term interest rates increase, the value of a bond has to fall  in order to match current yields. The NAV of a bond fund holding such long term bonds will decrease
Similarly if long term interest rates decrease, the value of a bond increases to match current yield levels and the NAV of the bond fund increases.
So when long term rates increase, debt funds with maturity duration much lower than 10 years is preferred and vice-versa.
Analogously, when 1Y rates decrease, debt funds with maturity duration higher than 1 year is preferred  
Well, all this means is that in the current interest rate scenario, for long term goals, one can invest in debt fund with maturity values higher than 1 year but much lower than 10 years.
Unfortunately, that is stating the obvious! This is an all weather recommendation for long term goals!
However, this does not mean equity is overvalued or unfavorable.
Tactical asset allocation: Yield-Gap vs PE
Tactical asset allocation refer to the method in which the asset allocation of a portfolio is changed rather dramatically in line with stock and debt market conditions.
This can be done in several ways.
Tactical asset allocation incorporates an element of market timing by determining which market is more favourable.
P/E model the value of stocks are evaluated with their price to earnings ratio. High PE(>22) exit equity in phases. Low PE (~ <15) buy equity in phases
As mentioned above, according to the ‘PE model’, the market is neither overvalued or undervalued. So the ‘signal’ is stay put.
Yield Gap Model Instead of looking at only the stock market,  the price of the equity index is evaluated with respect to the debt index.
Defining Yield Gap like the DSP BR Asset allocation fund,
Yield gap = (10 year Govt. Securities yield) X (P/E Nifty index ratio)
The Yield Gap was 1.62 on 9th March 2014 and has increased to 1.72 on 7th April,
The 10 year G-sec rates are primarily responsible for this increase since the Nifty PE has more or less remained constant in this period.
Nifty PE vs Yield Gap
So if you take this increase in yield gap ratio seriously, you ought to decrease equity holding by a good 10-20% and shift to debt (see asset allocation strategy of the DSP BR fund)
Not sure if this is a smart thing to do when the Nifty PE has remained flat in that period and close to its long-term average.
Nifty long term average
If you see the 10 year moving average of the Nifty PE, you will see that we are still quite close to the average. This is true for also the 15 year average ~ 18.3.
So there is no need to tinker with the equity folio, unless it has shifted by more than 5% of the intended asset allocation.
The yield gap model is too conservative compared to the PE model and I think is unsuitable for young investors who ought to be aggressive. I think it should be used only in conjunction with the PE model.
Perhaps what one can do is to increase investments in debt funds  mentioned above, without tinkering with existing equity holdings.
So let us summarize:
New to mf investing: stay invested.
Goal less than 5 years away: Book some profit and prepare an exit strategy.
Goal more than 5 years away: Rebalance if equity portfolio has increased by 5% or so, or if your folio is not balanced in the first place!
Not investing with a goal in mind: find one first! The state of the markets can wait!
Feel free to leave a comment if you need the Excel data files for any of the plots in this post/blog.
Postscript In response to Deepak’s comment below, here is the  CNX 500 PE vs 10 PE moving average. Although the CNX 500 appears to be a bit more overvalued than the Nifty, I don’t think it is high enough to exit equities. It does require a close watch though.
CNX 500 PE moving average

India VIX: The Stock Market Volatility Index

India VIX: The Stock Market Volatility Index

 
As a student of market volatility, my eyes popped out in interest to learn that we have index that gives an idea about market volatility – the India Vix. India VIX is a measure of how volatile the market is expected to be over the next 30 days. Its calculation isdescribed here in extraordinary detail.  It is measured using Nifty Option prices  (why do I keep reading this as Nifty onion prices?!). Here is a good non-mathematical read:How is India VIX calculated?   
  • It is reported as a percentage.
  • A high value corresponds to high volatility in the next month and a low value corresponds to low volatility over the same period.
  • It is not a buy or sell indicator.
  • It is a short-term indicator of investor ‘fear’ and confidence
  • As a projection, it is subject to assumptions and approximations and must be used with caution.
  • India VIX is calculated based on the methodology outlined by the Chicago Board Options Exchange with some modifications made for use with the Nifty order book. They track US market volatility with VIX.
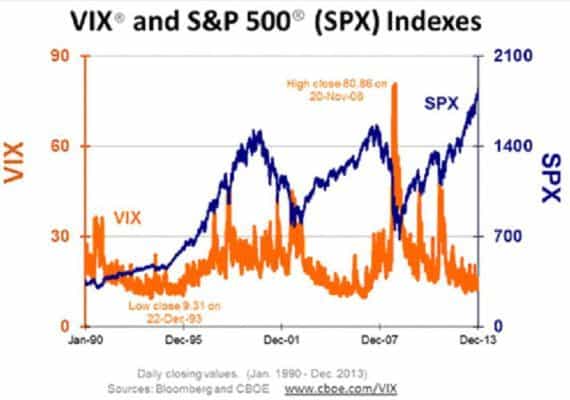
  • Here is how the VIX (US) correlates with its underlying index the S&P 500.
VIX
Picture courtesy: Chicago Board Options Exchange
  • Notice that when VIX is low and does not fluctuate too much, investor confidence is high and the Index rises.
  • Sharp drops in the index increase the fluctuations in VIX.
  • Historical data for India VIX is available only from 2nd March 2009.
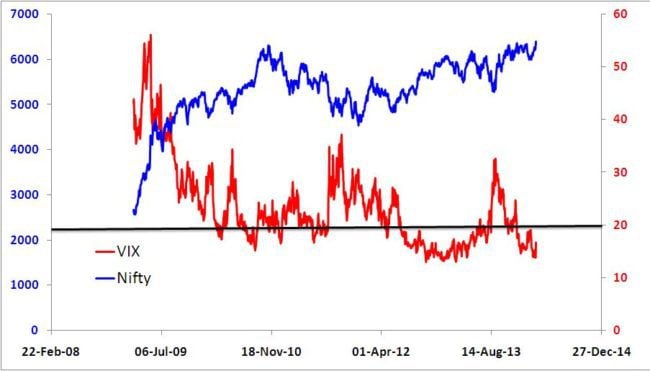
  • Here is how India VIX looks like when plotted alongside the Nifty.
India VIX vs. Nifty
  • There is a good 81% negative correlation between the movement of the Nifty and India VIX. That is, Nifty highs corresponds to VIX lows and vice-versa.
  • Again a decreasing VIX with low fluctuations can be taken as a sign of positive outlook and a market rally at least in the short term due to increase in investor confidence and decreasing fear.
  • The high volatility in 2011 is a result of global economic fears and high interest rates.
  • The sharp VIX peak in Aug. 2013 corresponds to the sharp drop in the value of the Rupee.
  • The volatility has been steadily decreasing for close to two years now.
  • Does it mean this is a good time to invest? The VIX does not exactly tell you that. However, it does tell you that the nerves are calming down, and the confidence in the India-Growth dream is growing.  Therefore, from that point of view, yes it is a good time to be in the market!

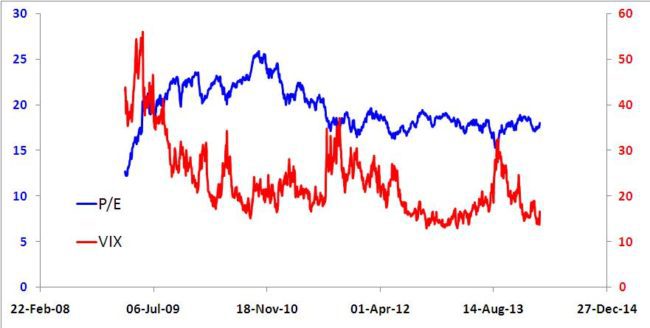
  •  Here is how the India VIX and Nifty P/E have evolved
India VIX vs. Nifty P/E
  • An upward spike in India VIX seems to correlate with a dip in NIFTY P/E. However, the correlation between the two is quite poor (-12%). This is to be expected as P/E considers earnings over the last 12 months.
  • Curiously in late 2010, when P/E was close to 25 a clear ‘sell’ indicator, the value of India VIX was ~ 20% a reasonably ‘low’ volatility.
  • However, India VIX fluctuated rapidly in this period.
  • This suggests that, for the long term investor, fluctuations in India VIX over a period, rather than the daily VIX value is a more useful indicator of market volatility.
  • Long term trends help assure ourselves of the benefits of staying invested.
  • In hindsight, past data of a future predictor reveals more that its daily value!
  • Investors can now diversify their portfolio or hedge portfolio risk with market volatility!India Vix Futures
  •  It is good to know that confidence in the market is growing.  Let us hope it lasts … and spills over to the retail investor.