Misconceptions about the Nifty PE
Are the markets overvalued? Is the Nifty PE too high? Should I exit and re-enter later? Aided by ‘experts’ who advice ‘caution’, such questions are doing the rounds again. Here are some misconceptions and myths about the Nifty PE.
In a previous post on the relevance of the Nifty PE for the long-term investor, I had shown that whether one exits at high PE and/or re-enters or high PE, there is no guarantee or loss-prevention or large gains and that there is a huge spread in returns.
I wrote, the case for not investing at high PE (~ 25) remains strong enough, whereas the case for investing only at low PE (< 15) has weakened, thanks to the wide range of returns possible.
Dumb me, I missed the obvious corollary:
If I exit at PE = 25, when do I enter? The answer is whenever!
So one could, and must argue, why exit in the first place if your goal is several years away?
Unfortunately, neither can we rely on past data (our market history is too short), nor can we invest without emotion. So for someone with considerable net worth, it is not a terrible idea to reduce equity exposure at 25 PE.
There is the danger that after exit the markets may create history and keep moving up but I think it is not such a terrible issue for a mature person.
With that out of the way, let us consider what Prof. Sanjay Bakshi writes in an article titled,“Keeping you out of trouble: your resolutions for 2009 and beyond”, he says

The red dots refer to the PE when 3 year returns were negative if invested on that date.
Notice most of the data is centered around the dot-com crash. PE values from about 16 to 20 led to negative returns and not just 22.
Notice the small bunch of red points right in the middle of the so-called ‘bull run’. Related reading: Anatomy of a bull market
Then we have some points just before the 2008 crash and some points in 2010 when PE was close to 25.
A negative 3 year return and a PE of 22 or above occurred only 42.7 times out of 100! The rest of the times, the negative returns came when PE was between 15 and 22! Please don’t bet that a high PE implies a low return …. at least over 3Y!
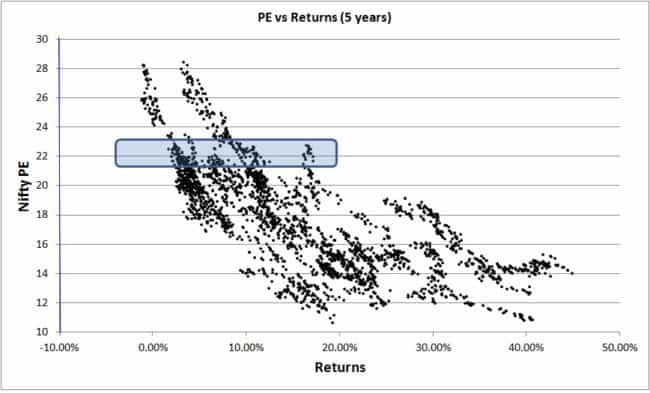
Notice the spread in returns possible corresponding to the PE on the date of investment. Current PE is close to 22. So the blue box tells you what to expect or rather what not to expect.

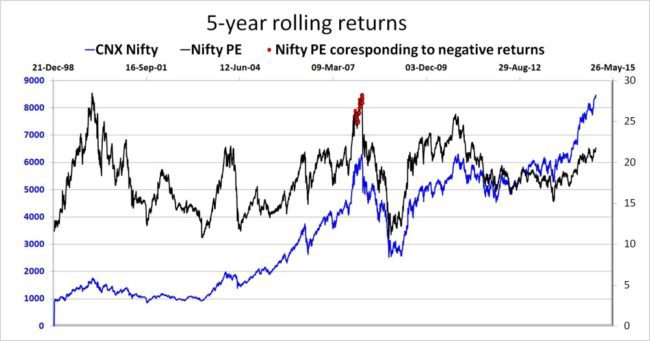
Now to 5 year returns. There is not enough negative returns data available. All points in that bunch correspond to a PE greater than or equal to 24.5.
Meaning, if you stay invested for 5 years, current PE most likely does not matter!
In a previous post on the relevance of the Nifty PE for the long-term investor, I had shown that whether one exits at high PE and/or re-enters or high PE, there is no guarantee or loss-prevention or large gains and that there is a huge spread in returns.
I wrote, the case for not investing at high PE (~ 25) remains strong enough, whereas the case for investing only at low PE (< 15) has weakened, thanks to the wide range of returns possible.
Dumb me, I missed the obvious corollary:
If I exit at PE = 25, when do I enter? The answer is whenever!
So one could, and must argue, why exit in the first place if your goal is several years away?
Unfortunately, neither can we rely on past data (our market history is too short), nor can we invest without emotion. So for someone with considerable net worth, it is not a terrible idea to reduce equity exposure at 25 PE.
There is the danger that after exit the markets may create history and keep moving up but I think it is not such a terrible issue for a mature person.
With that out of the way, let us consider what Prof. Sanjay Bakshi writes in an article titled,“Keeping you out of trouble: your resolutions for 2009 and beyond”, he says
Resolution 1: You will avoid equities when they become historically expensive
Recent research done by my firm shows just how dangerous it is to remain invested in an
expensive market. Since NSE started, every time when Nifty’s Price/Earnings ratio exceeded 22, the
average return from Indian equities over the subsequent three years became negative — see
accompanying table.
Nifty’s PE Three year returns%
Less than 14 152.10%
14 -16 112.36.%
16 – 18 79.14%
18 – 20 51.18%
20 – 22 21.18%
22 – 24 -14.98%
24 – 26 -32.92%
26 – 28 -36.60%
28 – 30 -40.17%
I am afraid averages without considering standard deviation or the spread is of little use. To imply and to assume that the return was negative when PE exceeded 22, based on this result is baseless, at least for Nifty stocks.
Rolling returns offer better insight.
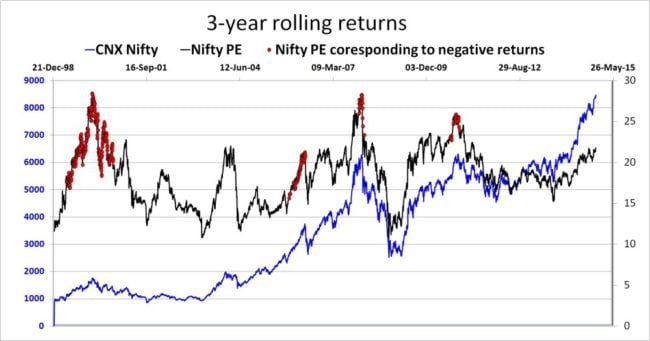
The red dots refer to the PE when 3 year returns were negative if invested on that date.
Notice most of the data is centered around the dot-com crash. PE values from about 16 to 20 led to negative returns and not just 22.
Notice the small bunch of red points right in the middle of the so-called ‘bull run’. Related reading: Anatomy of a bull market
Then we have some points just before the 2008 crash and some points in 2010 when PE was close to 25.
A negative 3 year return and a PE of 22 or above occurred only 42.7 times out of 100! The rest of the times, the negative returns came when PE was between 15 and 22! Please don’t bet that a high PE implies a low return …. at least over 3Y!
Notice the spread in returns possible corresponding to the PE on the date of investment. Current PE is close to 22. So the blue box tells you what to expect or rather what not to expect.
Now to 5 year returns. There is not enough negative returns data available. All points in that bunch correspond to a PE greater than or equal to 24.5.
Meaning, if you stay invested for 5 years, current PE most likely does not matter!
Notice that the bunch (below) has not shifted to the right. Again the spread is too large.
You can see similar graphs for longer durations here: relevance of the Nifty PE for the long-term investor
Here is the Excel sheet used
Moral of the story: If you want to exit because the PE is ‘high’, please do not point to market history. Point to yourself.
No comments:
Post a Comment