SIP Rolling Returns Analysis with Sensex Data
No matter how often we mention/promote/advertise that equity investments if continued over a long enough period would generate handsome returns, many investors seem to require constant reassurance and encouragement to continue their equity investments.
A person who wishes to remain anonymous made the following SIP rolling returns analysis with Sensex data to provide his friends this reassurance and encouragement. He readily and most generously agreed to share his analysis but chose to remain anonymous
The analysis
Assuming a SIP investment in an index mutual fund that tracks the Sensex, rolling return averages have been approximately calculated for 1, 2, 3, 5, 10, 15, 20, 25 and 30 year periods.
For data ranging from April 1979 to Aug. 2013 there would be as many as 53 periods of 30 year duration separated by a month! For example, April 1979 to 2009 is the 1st period, May 1979 to May 2009 the 2nd period and so on.
Part of the results are tabulated below
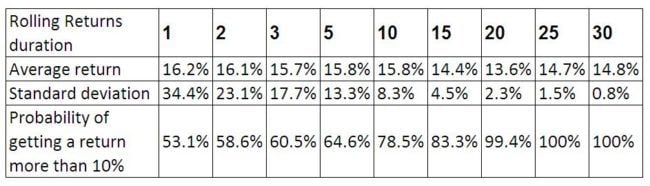 Notice how the average* SIP return varies only by about 2%. This however, has no meaning unless we look at the standard deviation. (* average here is the arithmetic average of all rolling return data)
Standard deviation, as mentioned before is a measure of how much the actual results can vary from the average, assuming that the data points follows a normal distribution (a very good introduction to normal distributions may be found here).
A more endearing definition:
The average 1 year rolling return is 16%. The standard deviation is 34%. This means 68 times out of 100, the return you get will be anywhere between 16% -34% to 16%+34%.
This just means over a one-year period, the return could just about be anything!
Contrast this with the data for a 20-year rolling return. Over this duration, 68 times out of 100 the return you get will be anywhere between 13.6%-2.3% to 13.6%+2.3%
That is the range of fluctuations in the returns has come down significantly when the investment tenure is longer. In the table, you can see that the standard deviation drops to 1-2% for a tenure of 20 years or more.
The increase in probability of getting more than 10% return with increase in investment tenure is a consequence of the decrease in standard deviation.
Bottomline: If we start a SIP in a diversified equity mutual fund for a long-term goal a good 15-20 years away and never stop it, the chances of us getting a double-digit return is reasonably high. The simplest example of such a fund is an index fund as assumed in this analysis.
Take-home message:
Equity investments are capable of producing high returns only because they are volatile. The only way to take advantage of fluctuating returns is to stay invested.
That way the fluctuations become much smaller than the average return (more on this later).
That is the geometric average of fluctuating returns when considered for a long enough period is high with a small standard deviation. To put it plainly the net return is high!
Download the SIP Rolling Returns analysis with Sensex data
(It also includes a lump sum analysis)
If you wish to learn more about volatility you could try out these calculators:
Portfolio Rebalancing –Volatility Simulator
Debt Fund vs. FD –Volatility Simulator
Credits:
As mentioned before, this analysis was made by a person who wishes to remain anonymous. Please join me in thanking him for his generosity.
Do share your thoughts on this analysis.
A person who wishes to remain anonymous made the following SIP rolling returns analysis with Sensex data to provide his friends this reassurance and encouragement. He readily and most generously agreed to share his analysis but chose to remain anonymous
The analysis
Assuming a SIP investment in an index mutual fund that tracks the Sensex, rolling return averages have been approximately calculated for 1, 2, 3, 5, 10, 15, 20, 25 and 30 year periods.
For data ranging from April 1979 to Aug. 2013 there would be as many as 53 periods of 30 year duration separated by a month! For example, April 1979 to 2009 is the 1st period, May 1979 to May 2009 the 2nd period and so on.
Part of the results are tabulated below
Results of SIP Rolling returns analysis with Sensex data
Standard deviation, as mentioned before is a measure of how much the actual results can vary from the average, assuming that the data points follows a normal distribution (a very good introduction to normal distributions may be found here).
A more endearing definition:
The average 1 year rolling return is 16%. The standard deviation is 34%. This means 68 times out of 100, the return you get will be anywhere between 16% -34% to 16%+34%.
This just means over a one-year period, the return could just about be anything!
Contrast this with the data for a 20-year rolling return. Over this duration, 68 times out of 100 the return you get will be anywhere between 13.6%-2.3% to 13.6%+2.3%
That is the range of fluctuations in the returns has come down significantly when the investment tenure is longer. In the table, you can see that the standard deviation drops to 1-2% for a tenure of 20 years or more.
The increase in probability of getting more than 10% return with increase in investment tenure is a consequence of the decrease in standard deviation.
Bottomline: If we start a SIP in a diversified equity mutual fund for a long-term goal a good 15-20 years away and never stop it, the chances of us getting a double-digit return is reasonably high. The simplest example of such a fund is an index fund as assumed in this analysis.
Take-home message:
Equity investments are capable of producing high returns only because they are volatile. The only way to take advantage of fluctuating returns is to stay invested.
That way the fluctuations become much smaller than the average return (more on this later).
That is the geometric average of fluctuating returns when considered for a long enough period is high with a small standard deviation. To put it plainly the net return is high!
Download the SIP Rolling Returns analysis with Sensex data
(It also includes a lump sum analysis)
If you wish to learn more about volatility you could try out these calculators:
Portfolio Rebalancing –Volatility Simulator
Debt Fund vs. FD –Volatility Simulator
Credits:
As mentioned before, this analysis was made by a person who wishes to remain anonymous. Please join me in thanking him for his generosity.
Do share your thoughts on this analysis.
No comments:
Post a Comment