Update: Nifty Valuation analyzer – rolling standard deviation
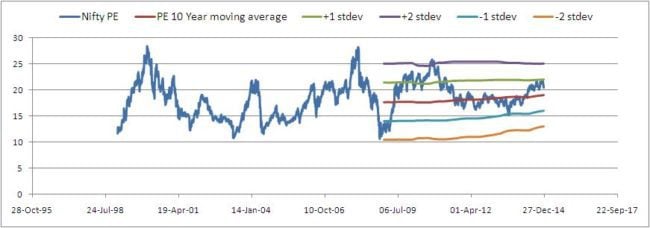
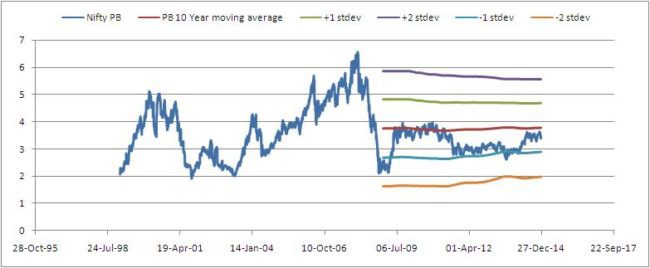
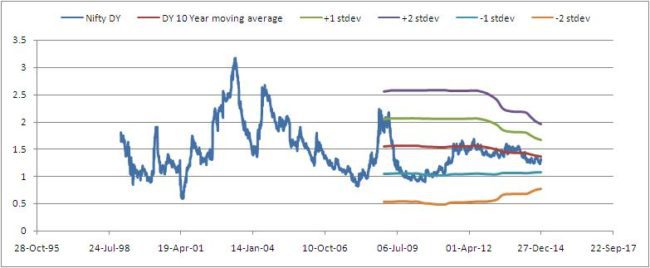
The Nifty valuation analyzer now has rolling standard deviation(stdev) curves plotted along with the rolling average PE, PB and Div yield curves.
As pointed out by Ravi Vooda, the
Here are some results
Notice that the standard deviation is more sensitive than the average to time. That is changes more rapidly as the days advance. So while one can assume that the Nifty is dangerously overvalues when the PE and/or PB exceeds two standard deviations above the average, we must also recognise that the standard deviation and the average are changing with time. So our assumption could be wrong.
I would like to make it clear that my interest in such analysis is only to find out dangerous valuations. There is no point in either not investing or pulliing out when the Nifty breaches, say 22. As pointed out here
As pointed out by Ravi Vooda, the
- mean + stdev, and mean + 2*stdev,
- mean – stdev, and mean – 2*stdev
Here are some results
Nifty PE
Nifty PB
Nifty Div. Yield
Notice that the standard deviation is more sensitive than the average to time. That is changes more rapidly as the days advance. So while one can assume that the Nifty is dangerously overvalues when the PE and/or PB exceeds two standard deviations above the average, we must also recognise that the standard deviation and the average are changing with time. So our assumption could be wrong.
I would like to make it clear that my interest in such analysis is only to find out dangerous valuations. There is no point in either not investing or pulliing out when the Nifty breaches, say 22. As pointed out here
No comments:
Post a Comment